Site speed optimization 2026: a Core Web Vitals field guide, diagnosed from real-user data
Do not fix what a lab tool flags. Read how real visits feel, find the one part of the one metric that is slow, fix only that, and check the field again before you touch anything else.
Site speed optimization 2026: how do you optimize site speed this year?#
You optimize site speed in 2026 by reading field data at the 75th percentile, finding the failing Core Web Vital, splitting it into subparts and fixing the largest one. Then you read the field again, because a fix is only real once real visits show it. That loop is the whole method, and every section below deepens one step of it.
Read the loop as an order, not a menu. It starts from the field, never the lab, and it makes you attribute before you act. The web.dev Web Vitals page, updated October 2024, sets the rule that makes this work: a page passes when it meets all three targets at the 75th percentile of page loads, split by mobile and desktop (Web Vitals). In short, the grade comes from your slowest quarter of real visits, so that quarter is where the work goes.
Why start from field data instead of a 20-item checklist?#
The HTTP Archive Web Almanac 2025, updated May 2026, counts only 48% of mobile websites passing all three Core Web Vitals in July 2025 field data. Desktop does better, at 56% in the same chapter, and both have climbed since 2021.
Show data table
| Dimension | mobile | desktop |
|---|---|---|
| 2021 | 32 | 41 |
| 2022 | 31 | 44 |
| 2023 | 36 | 48 |
| 2024 | 44 | 55 |
| 2025 | 48 | 56 |
Fewer than half of mobile websites pass all three, though both devices have climbed every year since 2021.
Search this topic and most results hand you the same list of tips. But that list never asks whether your page needs any of them. So you apply generic fixes and hope one lands, which is costly guessing.
A checklist is prescription first. It lists fixes with no tie to your data, so you cannot tell which item is your bottleneck. Diagnosis first flips the order. First it asks which metric fails in the field, then it asks which subsystem owns that metric. For example, a slow first byte is a server problem, so backend query bottlenecks that inflate server response time matter more than any image trick.
Core Web Vitals pass or fail at the 75th percentile, so most real visits must clear the good line, not just the typical one. An average hides your failing quartile, and a single test run hides it completely. Also, the PageSpeed Insights page, updated 2 June 2025, compares its own field data with CrUX and notes: "Both data sources represent trailing 28-day periods." Therefore a fix you ship today takes weeks to show fully in the grade.
The CrUX methodology, updated 20 June 2024, explains how Chrome collects this data from real user experiences, and which users, pages and origins qualify. Because it comes from real visits, it is the verdict that counts.
What are the Core Web Vitals thresholds in 2026?#
Google's web.dev metric pages, as of September 2025, call a page good at an LCP of 2.5 seconds, an INP of 200 milliseconds and a CLS of 0.1, read at p75. Each one also has a poor line, and the band between the two is "needs improvement".
| Metric | What it measures | Good at p75 | Poor at p75 |
|---|---|---|---|
| Largest Contentful Paint | when the largest element paints | 2.5 s or less | over 4 s |
| Interaction to Next Paint | how fast the page answers a tap or click | 200 ms or less | over 500 ms |
| Cumulative Layout Shift | how much visible content moves | 0.1 or less | over 0.25 |
Source: web.dev metric pages for loading (September 2025), response (September 2025) and layout shift (April 2023).
The loading page puts it plainly: "A good LCP value is 2.5 seconds or less." Then the responsiveness page, updated September 2025, sets good at 200 milliseconds and poor above 500 milliseconds. Finally, the layout shift page, updated April 2023, sets good at 0.1 and poor above 0.25.
On a phone, loading is the line most sites miss.
The Almanac 2025 counts 62% of mobile pages with good loading, against 77% for response and 81% for layout shift. In practice, that makes loading the first suspect on a phone, and response the second.
Show data table
| Item | Value |
|---|---|
| LCP | 62 |
| INP | 77 |
| CLS | 81 |
Loading is the metric mobile websites miss most often.
The routing table: which fix does your failing metric actually need?#
Each failing subpart has one owner: a slow first byte belongs to the server, a late LCP image to the markup, and a long task to JavaScript. The web.dev list of the most effective fixes, updated October 2024, ranks fixes the same way, by real-world impact first.
Read down to your failing subpart, then across to the one fix. The millisecond column is an illustrative range for planning, not a measured result.
| Failing metric and subpart | Most likely cause | The one fix | Illustrative ms saved | Effort |
|---|---|---|---|---|
| Loading: time to first byte | slow server or origin round trip | cache or render at the edge | 400 to 1,200 | medium |
| Loading: resource load delay | hero image found late | preload it with fetchpriority=high | 200 to 600 | low |
| Loading: resource load duration | oversized or old-format image | AVIF or WebP at the rendered size | 300 to 900 | low |
| Loading: element render delay | render-blocking CSS or script | inline critical CSS, defer the rest | 150 to 500 | medium |
| Response: processing duration | one long main-thread task | yield, and break the task up | 80 to 300 | medium |
| Layout shift: shift source | unsized media or a late banner | reserve space with aspect-ratio | score to near 0 | low |
Illustrative ranges for planning, not a benchmark of any page.
Read the effort column as a tie-breaker. Since two low-effort fixes clear many loading problems, you rarely start with the medium ones. Then re-measure the field before you pull the next one.
How do you improve INP by fixing its three subparts?#
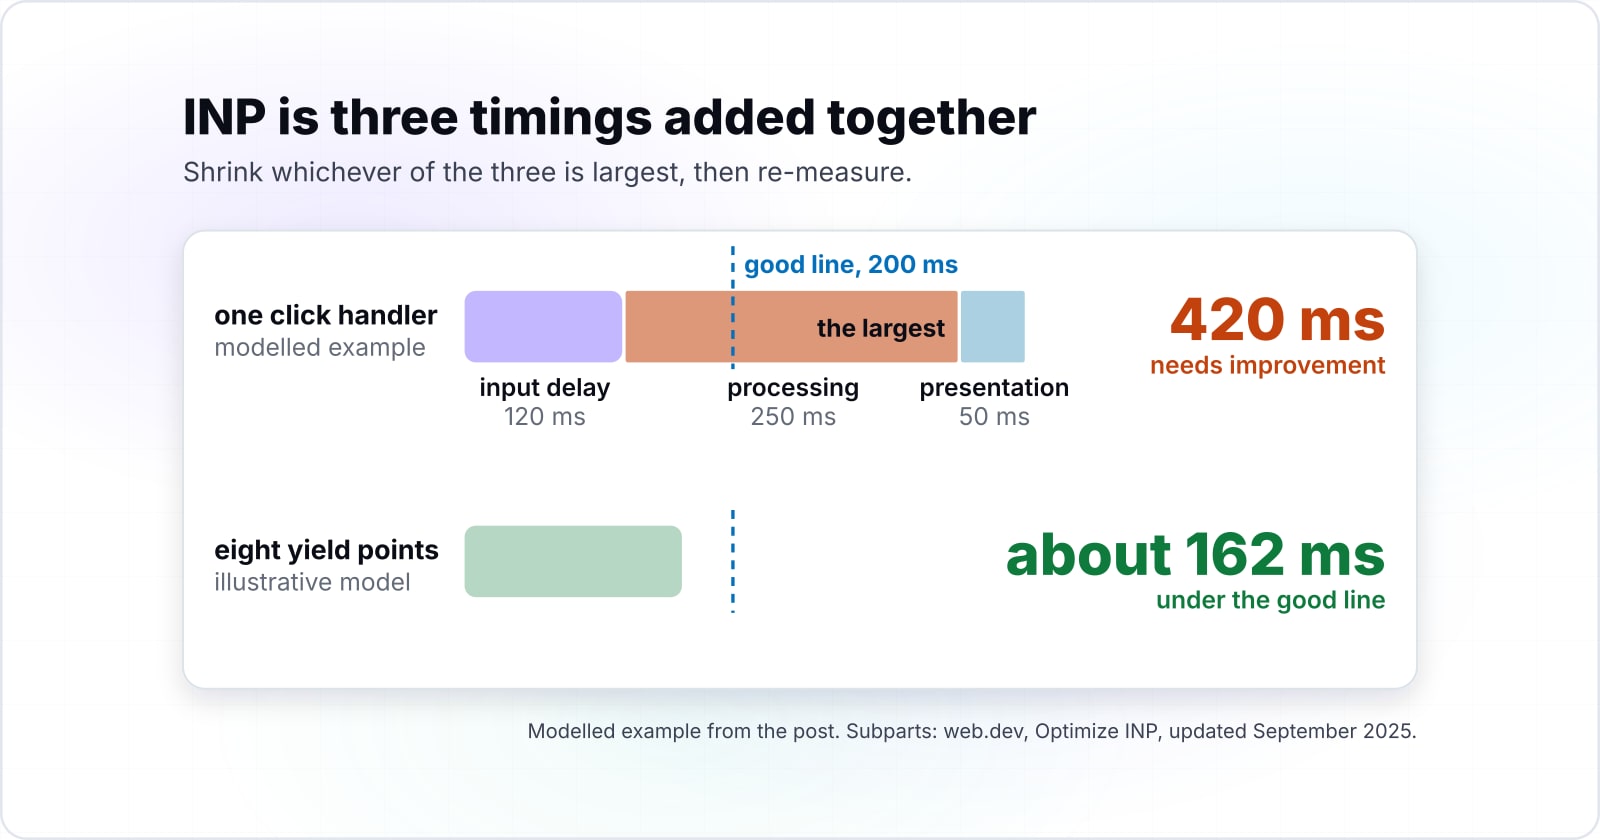
INP is three timings added together, input delay, processing duration and presentation delay, so you improve it by shrinking whichever of the three is largest. The Optimize INP guide on web.dev, updated September 2025, names the three INP subparts in order.
- "The input delay, which starts when the user initiates an interaction" and runs until your handler can start.
- "The processing duration, which consists of the time it takes for event callbacks to run to completion."
- "The presentation delay, which is the time it takes for the browser to present the next frame" after the handlers finish.
This metric is the successor to First Input Delay (FID), which the web.dev responsiveness page notes only measured the input delay of the first interaction. Instead, the newer metric looks at every interaction, so it is harder to fake and harder to fix.
Meanwhile, mobile response is getting better, and the busiest sites are catching up fastest.
Show data table
| Dimension | 2024 | 2025 |
|---|---|---|
| All websites | 74 | 77 |
| Top 1,000 websites | 53 | 63 |
Good response rose on mobile in 2025, and the top 1,000 websites gained the most.
Now take an illustrative case. As a modelled example, say one click handler does 250 ms of work on a mid-range phone, with a 120-millisecond input delay and a 50 ms frame. In this modelled example, the total is 420 ms, which sits in the needs-improvement band. Because processing is the largest subpart, it is the one to attack.
The 250 ms handler, split into 1 chunk
Each yield ends a task, so the browser can take the next input and paint between chunks.
Good line: 200 ms. Poor above 500 ms.
| Yields | Input delay | Processing | INP total |
|---|---|---|---|
| 0 | 120 ms | 250 ms | 420 ms |
| 1 | 80 ms | 145 ms | 275 ms |
| 2 | 67 ms | 110 ms | 227 ms |
| 3 | 60 ms | 93 ms | 203 ms |
| 4 | 56 ms | 82 ms | 188 ms |
| 5 | 53 ms | 75 ms | 178 ms |
| 6 | 51 ms | 70 ms | 171 ms |
| 7 | 50 ms | 66 ms | 166 ms |
| 8 | 49 ms | 63 ms | 162 ms |
An illustrative model, not a benchmark. It assumes each yield point splits the handler into one more chunk and that presentation delay is a fixed frame cost. Real numbers move with your device and your other scripts.
Then notice which subparts move as you add yield points. When you yield, the longest task gets shorter, so input delay and processing fall together. Meanwhile, presentation delay holds near its floor, because it is the cost of one frame. In the illustrative model, eight yield points bring the total to about 162 ms, under the good line.
The top Core Web Vitals guide on web.dev, updated October 2024, says a task over 50 milliseconds is a long task, and it names scheduler.yield() as the way to break one up. Also, the Optimize INP guide shows setTimeout as a way to run work in a new task in every browser.
// Break one long click handler into shorter tasks.
button.addEventListener('click', async () => {
  const parsed = parsePayload(raw);
  await scheduler.yield(); // let the browser paint and take input
  const items = buildResults(parsed);
  await scheduler.yield();
  renderList(items);
});// Run only the visual update now; push the rest to a new task.
button.addEventListener('click', () => {
applyVisualState();
setTimeout(() => {
sendAnalytics();
prefetchNextView();
}, 0);
});So read the two blocks as a progression. First, chunk the task, so the interaction starts and paints sooner. Then defer whatever the user does not wait on. Analytics and prefetch never change what the user sees, so moving them off the interaction path drops them out of the score. When you debug locally, Chrome's INP breakdown insight, updated October 2025, shows the same three subparts in the Performance panel.
What actually moves LCP in 2026, and how is LCP different from FCP?#
Google's web.dev Optimize LCP guide, updated March 2025, gives about 40% of LCP to the first byte and about 40% to the image download, with under 10% each for two delays. Those four parts are time to first byte, resource load delay, resource load duration and element render delay.
Show data table
| Item | Value |
|---|---|
| Time to first byte | 1,000 |
| Resource load delay | 250 |
| Resource load duration | 1,000 |
| Element render delay | 250 |
The first byte and the download each get about 1,000 ms; the two delays share the rest.
Applied to the 2.5 second line, that budget is about 1,000 ms for the first byte and 1,000 ms for the download, by arithmetic on the guide's shares. So the two delays get about 250 ms each. In particular, a page whose load delay is far above that small slice has a discovery problem, not a size problem.
First Contentful Paint (FCP) is a different metric. It marks the first time any content paints, while the largest paint marks when the main element shows. The FCP page on web.dev, updated December 2023, calls 1.8 seconds or less good and over 3.0 seconds poor. Therefore treat the first paint as a clue that comes earlier, not as a Core Web Vital.
And attribution comes before action here too. First find the largest element from field data, because it is often not the one you assume. Then trace which subpart holds it back. Often the biggest share goes on the first byte, before anything paints at all. To see where that byte comes from, read the request lifecycle behind every page load. For the rendering side, edge rendering that cuts Time to First Byte on Cloudflare attacks the biggest subpart directly.
How do you eliminate layout shift at the source?#
Layout shift is fixed at the source by reserving space for every image, embed, ad slot and web font before it arrives, not by tuning after load. The layout shift page on web.dev, updated April 2023, scores each shift as the share of the screen that moved times the distance it moved.
In every case, the shift happens because a box arrives without a reservation. So reserving the box removes the cause, not just the symptom.
What blocks the critical rendering path, exactly?#
The HTTP Archive Web Almanac 2025, updated May 2026, counts fetchpriority=high on only 17.3% of mobile pages with an LCP image, while about 16% still lazy-load it. And preload is rarer still.
Show data table
| Item | Value |
|---|---|
| fetchpriority=high | 17.3 |
| preload | 2.1 |
| lazy-loaded LCP image | 16 |
Few mobile pages tell the browser their hero image matters, and about as many lazy-load it.
The critical rendering path runs from the first byte through parse, style, layout and paint. Both render-blocking CSS and synchronous scripts sit between parse and paint. As a result, they push out every load timing, while deferred scripts run later and never block the first frame.
Still, each blocking node has a matching move. First, inline the critical CSS and load the rest without blocking. Next, add defer or async to scripts, so parsing is not paused mid-document. Then split the bundle, so a route ships only the JavaScript it needs.
After that, the hero image needs two cheap moves. First let the browser find it early with a preload and high priority, then serve a modern format at the size it renders.
<!-- Found early and fetched first: cuts resource load delay. -->
<link rel="preload" as="image" href="/hero.avif" fetchpriority="high" />
<!-- Sized and modern: cuts load duration and reserves the box. -->
<img src="/hero.avif" srcset="/hero-800.avif 800w, /hero-1200.avif 1200w"
     sizes="(max-width: 800px) 100vw, 1200px"
     width="1200" height="630" fetchpriority="high" alt="Product hero" />
The loading guide covers this discovery gap under resource load delay. For the perceived-speed side, progressive web app patterns that improve perceived performance cover instant navigation and offline shells.
Why does Lighthouse say 98 while your users are failing?#
A Lighthouse score is one simulated load on one device profile, so it can read green while the 75th percentile of your real visits still fails. Lighthouse is an open-source audit tool from Google, and PageSpeed Insights runs it beside CrUX data for one address.
The PageSpeed Insights page, updated 2 June 2025, says test data is useful for debugging, while field data captures the real experience. It also says the test result comes from a simulated load on a single device with fixed network conditions. However, a simulated run has no real user to click or type, so it cannot grade response at all.
Also, the Almanac shows the gap in one number. Mobile response improved in 2025, yet Total Blocking Time (TBT), the test stand-in for main-thread blocking, rose sharply.
Show data table
| Dimension | 2024 | 2025 |
|---|---|---|
| Mobile | 1,209 | 1,916 |
| Desktop | 67 | 92 |
Median blocking time on mobile rose by more than half while desktop stayed low.
The Almanac 2025, updated 5 May 2026, reports the mobile median TBT rising from 1,209 ms in 2024 to 1,916 ms in 2025. In short, a test number and a field number can move in opposite directions, so each answers a different question.
One sample
Lighthouse runs one throttled load, which is easy to repeat but is one sample, not your audience.
No real input
It has no real person to tap or type, so it cannot measure response honestly.
Real visits at p75
CrUX reads real Chrome visits at p75, so it catches the slow phones and busy main threads a test never saw.
Trust the field
When the two disagree, trust the field, and use the test to find the cause.
The same method answers a common question: which CMS or host offers the best site speed and caching? Test it rather than trust a ranking. First, pick a few live sites on each candidate that look like yours. Then read their CrUX data at p75 in PageSpeed Insights, since that shows how real visitors fare on that stack. Finally, run the same Lighthouse test on each to see where the time goes. That way the choice rests on site performance optimization data for pages like yours, not on a vendor list.
Which documentation do you build the fix from?#
Build the fix from the web-vitals library README first, then the web.dev INP and LCP optimization guides, then the CrUX methodology to read the result. The web-vitals library is a small JavaScript package that measures each of the three metrics in real visits.
Four official pages, read in that order, are enough to measure, fix and check the result.
What is the smallest code that reports INP subparts from real users?#
The smallest useful code imports onINP, onLCP and onCLS from the web-vitals attribution build and sends each metric's subparts to your own endpoint. The file below is bundled after npm install web-vitals, as the README shows, and the README also shows a CDN form for pages with no build step.
import {onCLS, onINP, onLCP} from 'web-vitals/attribution';

function send(metric, parts) {
  const body = JSON.stringify({name: metric.name, value: metric.value, rating: metric.rating, ...parts});
  navigator.sendBeacon('/analytics', body);
}

onINP((metric) => {
  const a = metric.attribution;
  send(metric, {inputDelay: a.inputDelay, processingDuration: a.processingDuration, presentationDelay: a.presentationDelay});
});

onLCP((metric) => {
  const a = metric.attribution;
  send(metric, {timeToFirstByte: a.timeToFirstByte, resourceLoadDelay: a.resourceLoadDelay, resourceLoadDuration: a.resourceLoadDuration, elementRenderDelay: a.elementRenderDelay});
});

onCLS((metric) => send(metric, {largestShiftTarget: metric.attribution.largestShiftTarget}));
The README notes that navigator.sendBeacon() is widely supported and can send data while the page unloads. Next, group the results by page and read the 75th percentile of each subpart. The biggest one is your next fix, and CrUX later confirms whether it moved the grade.
What is a Core Web Vitals win actually worth?#
Google's web.dev case study on Rakuten 24, updated August 2022, counts a 53.37% rise in revenue per visitor after the team improved its Core Web Vitals. The same study counts a 33.13% rise in conversion rate.
| Outcome | Change |
|---|---|
| Revenue per visitor | up 53.37% |
| Conversion rate | up 33.13% |
| Average order value | up 15.20% |
| Average time spent | up 9.99% |
| Exit rate | down 35.12% |
The setup was clean. In the web.dev Rakuten 24 case study, August 2022, one busy landing page was split 50/50 for a month. Version A was tuned for speed, while version B was the original, with the speed work as the only change. The study says version A finished loading 0.4 seconds earlier in the mobile load test and showed no significant layout shift. Separately, Google's web.dev Rakuten 24 study links a good loading score with up to a 61.13% higher conversion rate.
Still, read those numbers as one published case, not a promise. On an online store, the pages that carry this effect are the product page and the checkout, which our ecommerce development work covers.
But a case study is not your page, so model your own numbers instead.
If both totals reached good, on your own numbers
- Modeled conversion uplift
- 8.7%
- Extra revenue / month
- $20,045
- Extra revenue / year
- $240,538
Current modeled revenue is about $230,400 a month. The uplift follows how far the LCP and INP totals sit over their good thresholds, capped at 30%. Any subpart you cut lowers its total by the same amount; once a total is good, further cuts to it model nothing. For context, Rakuten 24's controlled test moved revenue per visitor by 53.37% on one page, so this cap stays deliberately conservative.
| Subpart | Current | Budget | Over budget? |
|---|---|---|---|
| TTFB | 1100 ms | 1000 ms | yes, by 100 ms |
| Load delay | 300 ms | 250 ms | yes, by 50 ms |
| Load duration | 1400 ms | 1000 ms | yes, by 400 ms |
| Render delay | 500 ms | 250 ms | yes, by 250 ms |
| Input delay | 120 ms | 50 ms | yes, by 70 ms |
| Processing | 250 ms | 100 ms | yes, by 150 ms |
| Presentation | 50 ms | 50 ms | no |
An illustrative planning model, not a benchmark. The loading budgets follow web.dev's split of the 2.5 s good line: about 40% first byte, under 10% load delay, about 40% load duration and under 10% render delay. The response budgets are this model's own split of the 200 ms line; web.dev publishes none. Read your own p75 in CrUX before you bank any figure here.
Then notice how the money tracks the overshoot. The uplift follows how far each total sits over its good line, not any one subpart. Once a total is good, further cuts to that metric model nothing, which is the point where user experience optimization moves elsewhere.
When not to reach for these fixes, and what to fix instead?#
Skip these fixes when your field data already passes at p75, when the page has too little traffic to appear in CrUX, or when the slow step is a business process. Each case has a better tool.
First, a passing page. If all three metrics meet the good line at p75, a speed fix adds risk for no gain in the grade. Instead, measure a different page that is failing, since CrUX reports each page and each origin on its own.
Second, a page CrUX cannot see. The CrUX methodology says a page must be publicly discoverable and sufficiently popular, and pages below the popularity threshold are not included. For those pages, the web-vitals code above is the better tool, because it reports from your own visits.
Third, a slow step that is not the page. If people wait on an approval, a stock check or a long form, no loading fix helps. Instead, fix the step itself. Likewise, a page that ships a megabyte of unused third-party script needs a script budget and a hard look at each tag before any single fix.
Where to go next#
Start with the metric your field data fails, then follow the linked guides on Web Vitals basics, edge rendering and database latency for the subsystem that owns it. For the metrics themselves, read what the Core Web Vitals measure. For a slow first byte, read edge rendering on Cloudflare or common MySQL performance bottlenecks.
If you would rather have a team run the loop, our web performance work starts from the same field data. And for a store, ecommerce development covers the product and checkout pages. Still, the four documentation pages above are enough to do all of it yourself.