What are Web Vitals, how they work and why they matter for web performance
If you look after a site's speed, as a developer, product owner or site owner, sooner or later a Lighthouse score and a Core Web Vitals rating will disagree about the same page. Both can be right. Here is what each one measures, and what real visits to our own site showed.
What are Web Vitals, and which ones are Core Web Vitals?#
Web Vitals are Google's user experience metrics, and the three Core Web Vitals, LCP, INP and CLS, pass when at least 75% of page loads meet each good threshold. Google's Web Vitals overview, last updated 31 October 2024, puts it plainly: "Core Web Vitals are the subset of Web Vitals that apply to all web pages". So the other Web Vitals help you find a cause, while the core three are the ones every tool rates.
Each of the three answers one question a person would ask. Did the main content show up fast? Then, did the page react when I tapped? Finally, did things stay where I was about to click? So when you ask what are Core Web Vitals in one line, the answer is those three questions, scored on real visits.
The same 2024 overview sets the bar for how many visits count. It says "a good threshold to measure is the 75th percentile of page loads, segmented across mobile and desktop devices". In practice, a page is judged on the slower end of its own traffic, not its best run. Also, phones and laptops are judged apart. Because of that, a fast desktop load cannot hide a slow phone one.
Why do Core Web Vitals matter, and do they affect Google rankings?#
Google Search Central highly recommends good Core Web Vitals for success with Search, and the share of good page loads is a number a team can track every week. Google's Core Web Vitals page for Search, last updated 10 December 2025, says: "We highly recommend site owners achieve good Core Web Vitals for success with Search". The same page says good page experience "aligns with what our core ranking systems seek to reward".
That is a recommendation, not a formula. No weight for these metrics in ranking is published there. Nor does that page promise a position for a good score. Therefore, the honest claim is narrow: a good score is recommended, and it means real people waited less.
The second reason to care is closer to home. A share of good loads is a number you can put in a weekly report. Also, it moves when the site changes, so a team sees the effect of its own work.
For example, in our Cloudflare Web Analytics data, read 6 October 2026, loads on atyantik.com with a good largest paint rose from 67.5% to 90.0% after launch. In the same data, the poor share fell from 12.1% to 5.7%.
67.5%
Launch week, 14 to 20 September 2026
90.0%
Week of 28 September to 5 October 2026
The good share for the largest paint rose from 67.5% to 90.0% after launch, and the poor share fell from 12.1% to 5.7%.
| Option | percent of page loads rated good for LCP |
|---|---|
| Launch week, 14 to 20 September 2026 | 67.5% |
| Week of 28 September to 5 October 2026 | 90.0% |
Source: atyantik.com, Cloudflare Web Analytics, read 6 October 2026
What do LCP, INP and CLS measure, and what is a good INP score?#
LCP measures loading, INP measures responsiveness and CLS measures visual stability; good is LCP within 2.5 seconds, INP at 200 milliseconds or less and CLS at 0.1 or less. Google's thresholds article, last updated 7 May 2025, gives each metric a good band and a poor band. Between them sits "needs improvement".
Google's LCP article, last updated 4 September 2025, says LCP "reports the render time of the largest image, text block, or video visible in the viewport". In short, it times the moment the main thing on screen is drawn, which is when a page feels loaded.
Meanwhile, the responsiveness metric is about every tap, click and key press. Google's INP article, last updated 2 September 2025, says it observes "the latency of all click, tap, and keyboard interactions" in a visit. Then the final value is the longest one, with outliers ignored. So what is a good INP score? Per that 2025 article, it is 200 milliseconds or less at the 75th percentile, and over 500 milliseconds is poor.
Finally, CLS scores how much the layout jumps. Google's CLS article, last updated 12 April 2023, calls it the largest burst of layout shift scores for every unexpected shift. Because it is a score and not a time, it has no unit. That is Core Web Vitals explained in three lines: how fast, how responsive, how still. So the table below is the one every rating comes from.
| Metric | Good at or below | Poor above |
|---|---|---|
| Largest Contentful Paint (ms) | 2500 | 4000 |
| Interaction to Next Paint (ms) | 200 | 500 |
| Cumulative Layout Shift (score) | 0.1 | 0.25 |
How do Core Web Vitals differ from TTFB, FCP and the other Web Vitals?#
TTFB and FCP are Web Vitals outside the core three: they help diagnose a slow load, but no Core Web Vitals assessment passes or fails on them. Google's Web Vitals overview, last updated 31 October 2024, calls them "supporting metrics". It says both are "useful in diagnosing issues with LCP". So if you are still asking what are Web Vitals beyond the core three, start with these two.
First, TTFB, Time to First Byte, is how long the server takes to start its reply. Google's TTFB article, last updated 18 November 2025, says good values are 0.8 seconds or less and poor values are over 1.8 seconds. For what happens before that first byte arrives, see our walk through what happens when you hit a URL.
Second, FCP, First Contentful Paint, is when anything at all first shows. Google's FCP article, last updated 6 December 2023, sets good at 1.8 seconds or less and poor above 3.0 seconds. However, a fast first paint with a slow largest paint is common. In that case the page shows a header, then waits for the big image.
Total Blocking Time sits in a third group of its own. The overview calls it a lab metric. It is not in the core set because it is "not field-measurable". As a result, you will see it in a lab report and never in a field rating.
TTFB, Time to First Byte
The server starts its reply. Good is 0.8 seconds or less; poor is over 1.8 seconds.
FCP, First Contentful Paint
Anything at all first shows. Good is 1.8 seconds or less; poor is above 3.0 seconds.
LCP, Largest Contentful Paint
The main thing on screen is drawn. Good is within 2.5 seconds.
How does the 75th percentile rule decide a Core Web Vitals assessment?#
A page passes only when the 75th percentile of its real page loads is good for LCP, INP and CLS, judged separately for mobile and desktop. Google's PageSpeed Insights about page, read 6 October 2026, states the rule. PageSpeed Insights is Google's tool that shows field and lab data for one URL. It says "the aggregation passes the Core Web Vitals assessment if the 75th percentiles of all three metrics are Good".
But there is one exception, and it matters for quiet pages. The same page says that with too little interaction data, a page "will pass the assessment if both the 75th percentiles of LCP and CLS are Good". And with too little loading or layout data, it cannot be assessed at all.
Also, Google's thresholds article of 7 May 2025 frames the same rule as shares. If at least 75 percent of page views meet "good", the page is good. Meanwhile, if at least 25 percent meet "poor", the page is poor. The Search Console Core Web Vitals report, Google's site-wide view of the same data, splits it by mobile and desktop. Then it rates each URL group by its worst metric.
Here is the rule on real numbers, from our own field data for atyantik.com, read 6 October 2026. On launch day, 14 September 2026, our Cloudflare Web Analytics data rated 45.8% of 673 page loads good for loading. It rated 21.5% poor. Under 75% good means the day was not good. Under 25% poor means it was not poor either, so it sat in needs improvement.
| Rating | Page loads | Percent of page loads |
|---|---|---|
| good | 308 | 45.8 |
| needs improvement | 220 | 32.7 |
| poor | 145 | 21.5 |
| all rated page loads | 673 | 100.0 |
Across launch week, 14 to 20 September 2026, our Cloudflare data rated 67.5% of 3,168 page loads good. That is still below the line. So the 75th percentile load was slower than 2.5 seconds. In the next week of the same data, 90.6% were good, and the 75th percentile moved inside the good band. Meanwhile, responsiveness at 95.3% of 743 loads and layout stability at 98.5% of 2,923 loads were good all along.
Fails on LCP
fail- LCP: 67.5% of loads good, under the 75% line, so the 75th percentile load is not good
- INP: 95.3% of loads good, at or over the 75% line, so the 75th percentile load is good
- CLS: 98.5% of loads good, at or over the 75% line, so the 75th percentile load is good
Under 75% of loads are good for LCP, so its 75th percentile load is not good and the page fails. Starting shares: atyantik.com launch week, 14 to 20 September 2026, Cloudflare Web Analytics, read 6 October 2026.
| LCP, loads rated good | LCP: 67.5% of loads good, under the 75% line, so the 75th percentile load is not good |
|---|---|
| INP, loads rated good | INP: 95.3% of loads good, at or over the 75% line, so the 75th percentile load is good |
| CLS, loads rated good | CLS: 98.5% of loads good, at or over the 75% line, so the 75th percentile load is good |
| Verdict | Fails on LCP. Under 75% of loads are good for LCP, so its 75th percentile load is not good and the page fails. |
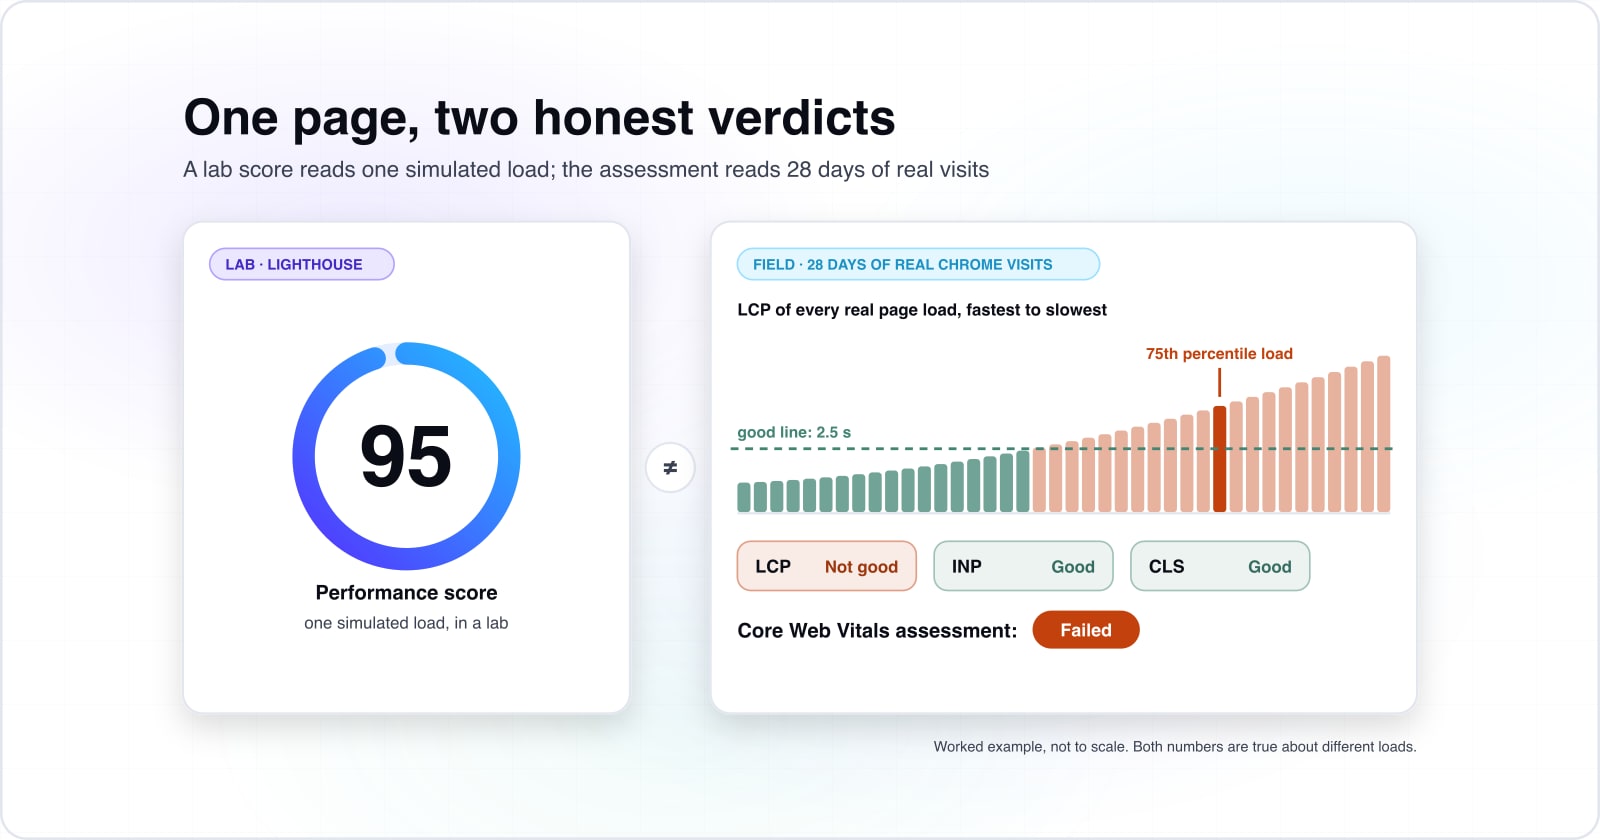
Why can a good Lighthouse score sit beside a failed Core Web Vitals assessment?#
Lighthouse scores one simulated load in a lab, while the assessment reads 28 days of real Chrome visits, and INP carries no weight in the Lighthouse 10 Performance score. Lighthouse is Google's lab audit tool. PageSpeed Insights, per its about page read 6 October 2026, runs it for its lab half. So Core Web Vitals vs Lighthouse is not a contest, because they answer two questions.
Google's Lighthouse scoring page, read 6 October 2026, lists the Lighthouse 10 weights. Total Blocking Time carries 30%, LCP 25%, CLS 25%, FCP 10% and Speed Index 10%. The responsiveness metric is not in the list, because a test load has no real person tapping. Instead, Total Blocking Time stands in for it.
Show data table
| Item | Value |
|---|---|
| Total Blocking Time | 30 |
| Largest Contentful Paint | 25 |
| Cumulative Layout Shift | 25 |
| First Contentful Paint | 10 |
| Speed Index | 10 |
Total Blocking Time carries the most weight, and the responsiveness metric is not in the list.
The field side, however, reads something else. The PageSpeed Insights about page, read 6 October 2026, says its field data covers "the previous 28-day collection period". It comes from the Chrome UX Report, Google's public dataset of real Chrome visits. Then there is the element gap. Google's lab and field article, last updated 18 July 2022, warns about it plainly. It says "The LCP element identified in a lab test may not be the same LCP element users see when visiting your page."
So a page whose Core Web Vitals assessment failed while Lighthouse shows 95 has no bug. Both numbers are true about different loads. To see how the lab score is built and read, our Lighthouse audit guide goes through it.
What did atyantik.com's own field data show after launch?#
On atyantik.com, Cloudflare Web Analytics rated LCP good on 67.5% of launch-week page loads and 90.0% by the week of 28 September, read 2026-10-06. Cloudflare Web Analytics is Cloudflare's analytics beacon, a small script that reports each real page load. Its Core Web Vitals docs, last updated 24 August 2026, say each metric "is automatically assigned a rating of Good, Needs Improvement, or Poor".
Launch day was the low point in the same data. On 14 September 2026, Cloudflare Web Analytics rated LCP good on 308 of 673 page loads, 45.8%, and poor on 145, 21.5%. Both were worse than the whole launch week, at 67.5% good and 12.1% poor.
Then two changes shipped right after. On 15 September, our blog cards stopped lazy loading the image that was the largest paint. On 16 September, our hashed /_astro/ files were cached for a year as immutable. Those are the build output files with a content hash in the name. Why each change helps, and how to make it, is the field guide's subject, not this one's.
By the second week, 21 to 27 September 2026, our Cloudflare good share for the largest paint was 90.6%. It held at 90.0% in the third week. However, the data does not separate those two changes from caches warming after launch. A new site starts with cold caches everywhere, and they fill as people visit. So we cannot tell how much of the rise came from each.
Show data table
| Dimension | LCP | INP | CLS |
|---|---|---|---|
| 14 to 20 Sep | 67.5 | 95.3 | 98.5 |
| 21 to 27 Sep | 90.6 | 94 | 99.2 |
| 28 Sep to 5 Oct | 90 | 91.2 | 98.9 |
LCP crossed the 75% line in the second week, while INP and CLS were good all along.
Two limits apply to every number here. First, this is Cloudflare's measurement from its own beacon, not Google's Chrome UX Report. Cloudflare's data collection page says when they are sent. The metrics "are reported when the visibilityState is hidden for the first time after the page load event is triggered". So it is not the data Search Console uses. Second, responsiveness had fewer samples than loading, because a page load only produces that value when someone interacts.
Why did INP replace FID, and why does it have fewer samples?#
INP replaced FID as a Core Web Vital in 2024 because it measures interactions across the whole visit, so only page loads with an interaction produce an INP value. FID, First Input Delay, timed only the wait before the first input was handled, and nothing after it. Google's article on the new metric, last updated 2 September 2025, says "FID only measured the input delay of the first interaction on a page".
Google's INP launch post of 12 March 2024 made the switch. It says Chrome tools would no longer promise FID data. It also says "developers will have until September 9, 2024 to transition over to INP". So any guide that still lists FID as a Core Web Vital is out of date.
The sample gap follows from the design. Someone who reads and leaves never taps, so that load has a loading and a layout value but no responsiveness value. As a result, in our Cloudflare Web Analytics data, read 6 October 2026, the responsiveness metric had 743, 671 and 800 rated loads in those weeks. In the same weeks, the loading metric had 3,168, 2,105 and 2,606.
Show data table
| Dimension | LCP | INP | CLS |
|---|---|---|---|
| 14 to 20 Sep | 3,168 | 743 | 2,923 |
| 21 to 27 Sep | 2,105 | 671 | 1,793 |
| 28 Sep to 5 Oct | 2,606 | 800 | 1,874 |
INP had far fewer rated loads than LCP each week, because only a load with an interaction produces an INP value.
Which documentation should you build field measurement from?#
Three pages cover field measurement from first call to dashboard: the web-vitals library README, web.dev's Web Vitals overview and Cloudflare's Core Web Vitals documentation. Google's Web Vitals overview says the Chrome UX Report lacks "per-pageview telemetry". As a result, it says "we strongly recommend that sites set up their own real-user monitoring".
Then read them in this order:
- The web-vitals README, the small JavaScript library Google's Chrome team maintains: take the
onLCP,onINPandonCLScalls and thesendBeaconexample. - web.dev's Web Vitals overview: take the thresholds and the 75th percentile rule your numbers will be read against.
- Cloudflare's Core Web Vitals docs: take the ready dashboard, which shows the 75th percentile (P75) for each page element.
What is the smallest code that reports Core Web Vitals from real visits?#
The web-vitals library reports LCP, INP and CLS from real browsers with three callbacks and one navigator.sendBeacon call in a few lines of JavaScript. navigator.sendBeacon() is the browser call that the README says "supports sending data as the page is being unloaded". So the README's own example does it in four steps: install, import, send, register.
// 1. Install: npm install web-vitals
// 2. Import the three Core Web Vitals callbacks.
import {onCLS, onINP, onLCP} from 'web-vitals';

// 3. Send each metric to your own endpoint as soon as it is ready.
function sendToAnalytics(metric) {
  const body = JSON.stringify({name: metric.name, value: metric.value, id: metric.id});
  navigator.sendBeacon('/analytics', body);
}

// 4. Register the callback for each metric, once per page load.
onCLS(sendToAnalytics);
onINP(sendToAnalytics);
onLCP(sendToAnalytics);
The /analytics path is the README's placeholder; point it at any endpoint that stores the JSON. Also, the README warns against calling these functions again and again on one page, since each one creates its own observer. Then, once values arrive, compute the share of good loads per metric. Read it against the 75% line from Google's 2024 overview.
When are Core Web Vitals the wrong tool?#
Core Web Vitals are the wrong tool for a page too quiet to appear in the Chrome UX Report, for debugging one slow load, or for judging anything besides user experience. In each case, a better tool exists.
First, a quiet page may never get a rating. Google's Chrome UX Report methodology, last updated 20 June 2024, says "A page must be publicly discoverable to be considered for inclusion in the CrUX dataset". It must also be "sufficiently popular", with a minimum number of visitors. So for a new or niche page, your own beacon from the code above gives you data Google will not.
Second, one slow load needs a lab trace, not a field share. Because field data says that loads are slow, not why, it cannot show you the cause. Instead, open the Performance panel in Chrome DevTools or run Lighthouse, and look at that one load in detail.
Third, these metrics judge how a page feels, not whether it works. For instance, a fast checkout that charges the wrong amount still scores well. In short, use them beside your error rates and conversion data, never in place of them.
Where should you go next to fix a failing metric?#
Fixes live in the Core Web Vitals field guide, the lab score in the Lighthouse post, and the first byte in the walk through what happens when you hit a URL. When you need a fix, start with our Core Web Vitals field guide, which takes each failing metric one cause at a time.
Then, for the lab score, read the Lighthouse audit guide. Next, the first byte is covered in what happens when you hit a URL. And to set budgets at the design stage of a large front end, read Module Federation and Core Web Vitals.
If you want a team to measure and fix this with you, our web performance service does that work. For real-user measurement and caching at the edge, see our Cloudflare development service. Still, if you only came to learn what are Web Vitals, you can stop here. The three docs pages and the snippet above are enough to start on your own.