What happens when you hit a URL: from typing it and pressing enter to a page on screen
This is what happens when you type a URL and press enter, with a real stopwatch on every network step and the address itself taken apart, part by part, so nothing in between stays a black box.
What happens when you hit a URL and press enter?#
When you hit a URL, the browser parses it, looks up the host, opens TCP and TLS, then sends the request, and our 7 October 2026 test timed it all at 170.5 ms for atyantik.com. Then rendering starts, inside the browser. The order of the steps comes from MDN's guide to how browsers work, updated 18 December 2025:
- Parse: the browser splits the address into its parts.
- DNS lookup: it asks a resolver for the IP address of the host.
- TCP connect: it opens a connection to that address.
- TLS handshake: it agrees keys with the server, so the rest is encrypted.
- Request and response: it sends an HTTP request and reads the reply.
- Render: it parses the HTML and CSS, then runs layout, paint and compositing.
How were these timings measured?#
Then we timed steps 2 to 5 with curl, a command-line tool that fetches a URL and prints how long each phase took. The test ran on 7 October 2026 at 07:16 UTC, with five rounds per site, from a Mac in Ahmedabad, India.
Every request left through Cloudflare WARP, a tunnel app that sends a device's traffic through Cloudflare's network. As a result, DNS lookups and the first hop rode Cloudflare's network. So the tunnel added its own detour to every connection. It may also flatter sites served from that same network, atyantik.com among them. In short, these are numbers from one desk on one morning, and your own network will print different ones.
The first byte is the moment the server's reply starts to arrive. For atyantik.com in that test, the median cold round spent its time like this:
Show data table
| Item | Value |
|---|---|
| DNS lookup | 4.9 ms |
| TCP connect | 21.9 ms |
| TLS handshake | 26.8 ms |
| Server wait | 38.6 ms |
| HTML download | 82.8 ms |
The HTML download, 82.8 ms, was the longest single phase for atyantik.com on a new connection.
Since each phase has its own cause, each has its own fix. Because the browser meets the address before the network, the parts of a URL come first below, then each network step in order.
Why does a reused connection matter more than a faster server?#
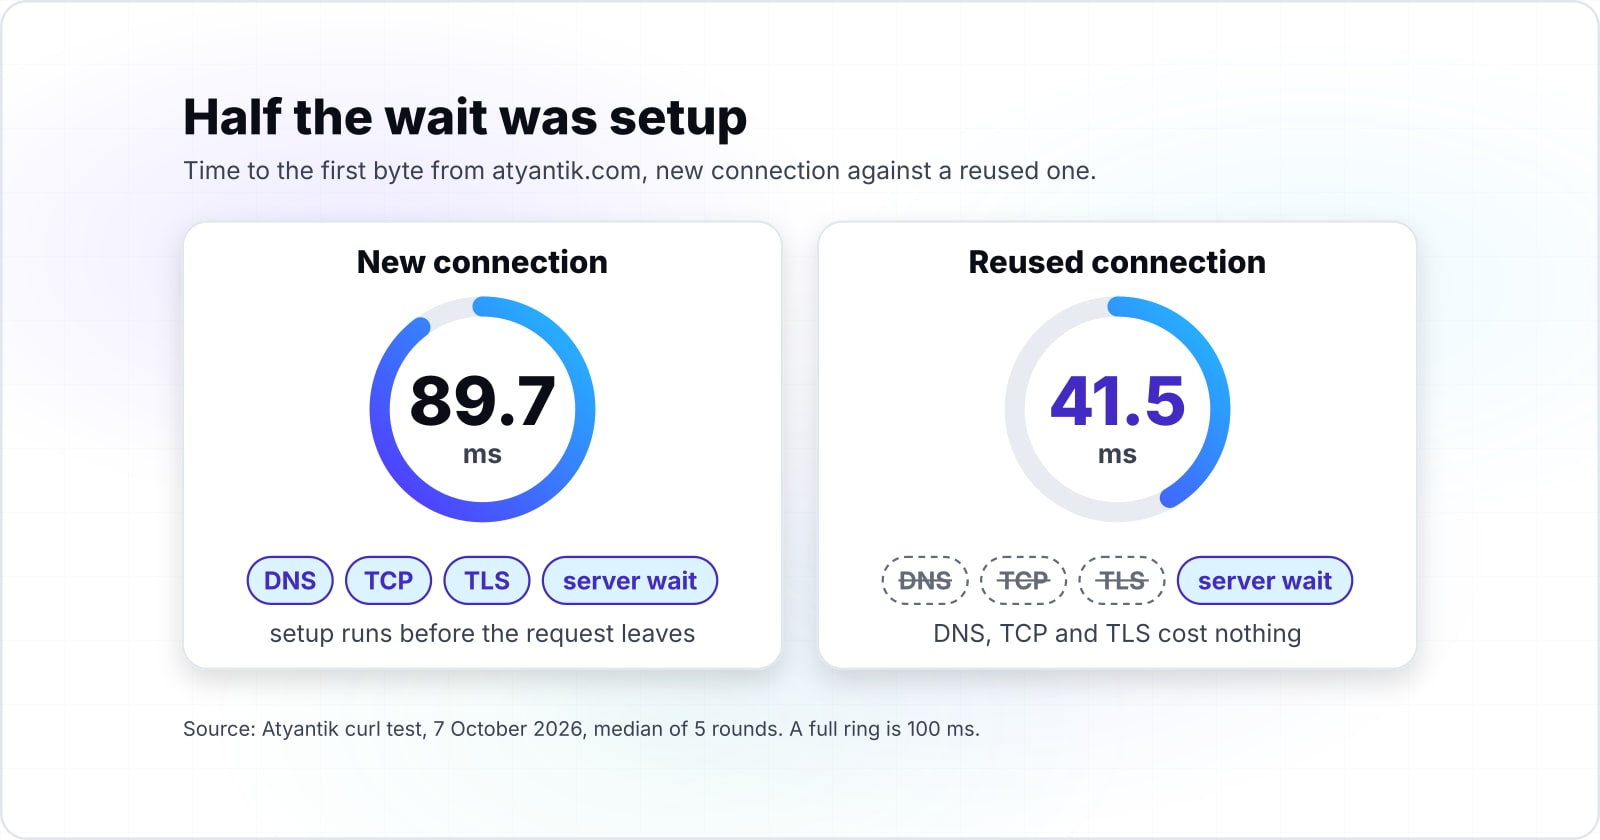
A reused connection skips DNS, TCP and TLS entirely, which cut the first byte from atyantik.com from 89.7 ms to 41.5 ms in our 7 October 2026 test. In other words, about half the wait on a new connection was setup, so the server was not the slow part.
The pattern held on every site we timed that day. Because a warm request is the second fetch on a connection that is already open, it reached the first byte far sooner than a cold one on every site:
Show data table
| Dimension | New connection (cold) | Reused connection (warm) |
|---|---|---|
| atyantik.com | 89.7 ms | 41.5 ms |
| example.com | 93.2 ms | 21.2 ms |
| www.wikipedia.org | 341.7 ms | 88.3 ms |
| developer.mozilla.org | 165.5 ms | 21.4 ms |
| github.com | 220.6 ms | 72.9 ms |
A reused connection reached the first byte sooner than a new one on all five sites.
This matters because a faster server only shrinks the server wait. Because setup is paid on every new connection, a page that pulls fonts, scripts and images from several hosts pays it once per host. For that reason, MDN's guide notes that a DNS lookup is needed "for each unique hostname the requested page references." Therefore, fewer hosts and kept-alive connections often help more than a quicker origin server.
In practice, that is also why the second visit to a site loads faster. Since the browser may still hold an open connection, a cached DNS answer and cached files, the next click starts closer to the finish line.
89.7 msto first byte
Whole HTML: 170.5 ms
- DNS lookup4.9 mstime_namelookup: the host name turned into an IP address.
- TCP connect21.9 mstime_connect minus the lookup: the three-way handshake.
- TLS handshake26.8 mstime_appconnect minus time_connect: keys agreed, server checked.
- Server wait38.6 mstime_starttransfer minus time_appconnect: request sent, first byte back.
atyantik.com, new connection: the first byte came at 89.7 ms, after 53.6 ms of DNS, TCP and TLS setup.
Medians of 5 rounds per site from one curl capture on 7 October 2026, so the phases need not sum to the first byte.
What is a URL, and what are its parts?#
A URL, short for Uniform Resource Locator, is the address of one resource on the web, split into a scheme, host, port, path, query and fragment. The name comes from RFC 1738, "Uniform Resource Locators (URL)". The IETF published it in December 1994. Today, the WHATWG URL Standard, last updated on 6 October 2026, sets out to align the older RFCs "with contemporary implementations", meaning the browsers in use.
For example, this one URL example holds every part, so it doubles as the anatomy of a URL: https://www.example.com:443/docs/guide.html?lang=en&page=2#install.
| Part | In the example | What it tells the browser |
|---|---|---|
| Scheme | https | which protocol to use; :// separates it from the rest |
| Host | www.example.com | which server to find, by its domain name |
| Port | 443 | which "gate" on the server; usually left out for HTTPS |
| Path | /docs/guide.html | which resource on that server |
| Query | ?lang=en&page=2 | extra key and value pairs, joined by & |
| Fragment | #install | a spot inside the resource, for the browser alone |
Source: MDN's What is a URL?, updated 8 January 2026, and RFC 3986.
MDN's URL guide says the port is usually left out when a server uses the standard ports, 80 for HTTP and 443 for HTTPS. Also, the host and port together form what MDN calls the authority. The "full page URL" is the absolute form above, with every part present.
What is the difference between an absolute and a relative URL?#
There are two URL types in daily use. An absolute URL carries every part, so it works anywhere. However, a relative URL such as /docs/guide.html leaves out the scheme and host. When a page links to it, the browser fills in the missing parts from the page's own address. That step is called URL resolution, and it is why one link works on any domain.
In code, the browser exposes the same split. The URL interface on MDN, updated 28 September 2026, gives each part a property: protocol, hostname, port, pathname, search and hash. So new URL() in JavaScript shows you the parse the browser runs first.
Why does the fragment never reach the server?#
The browser strips everything after the # before sending the request, because RFC 3986 says the fragment is dereferenced solely by the user agent. In the words of RFC 3986, from January 2005, the fragment "is separated from the rest of the URI prior to a dereference."
Also, MDN says the same in plainer terms. Its fragment reference, updated 22 June 2026, says the "fragment is not sent to the server when the URI is requested." Also, its URL guide adds that the part after the # "is never sent to the server with the request."
For the example above, the server is asked for /docs/guide.html?lang=en&page=2 and nothing more. Then, once the HTML arrives, the browser finds the element named install and scrolls to it.
So the fragment has three practical effects. First, server logs and server-side analytics never see a fragment, so they cannot count it. Second, a single-page app that routes by #/settings keeps that route in the browser, where JavaScript reads it from location.hash. Finally, a secret in a fragment does not reach the server, although it still sits in the address bar and in browser history.
How long can a URL be before something refuses it?#
HTTP asks every sender and recipient to support URIs of at least 8000 octets, and past that the strictest hop in the path decides. That floor is in RFC 9110, the IETF's HTTP standard from June 2022. It calls support for "URIs with lengths of 8000 octets in protocol elements" RECOMMENDED.
Past the floor, each hop sets its own cap, and these are the ones the vendors publish:
- Chrome: Chromium's source code caps a URL passed between its processes at
2 * 1024 * 1024characters. The constant iskMaxURLCharsin url_constants.h, read on 7 October 2026. - Cloudflare Workers: Cloudflare's Workers limits page, updated 5 September 2026, lists a URL size of 16 KB.
- Amazon CloudFront: The AWS CloudFront quotas page, read on 7 October 2026, sets the maximum length of a URL at 8,192 bytes.
So the usable length is the smallest cap on the path from the address bar to the server. A URL that Chrome accepts can still be refused by a CDN, a proxy or the origin. In practice, keep long state in a request body or in storage, not in the query string.
How long does the DNS lookup take?#
In our 7 October 2026 test, an uncached DNS lookup took 3.5 ms for atyantik.com and 248.8 ms for www.wikipedia.org, then about 5 ms once cached. Only round 1 saw an uncached answer, because the operating system kept the answer between runs.
Show data table
| Item | Value |
|---|---|
| atyantik.com | 3.5 ms |
| example.com | 33.3 ms |
| www.wikipedia.org | 248.8 ms |
| developer.mozilla.org | 5.5 ms |
| github.com | 60.8 ms |
The first, uncached lookup ranged from 3.5 ms for atyantik.com to 248.8 ms for www.wikipedia.org.
DNS is cheap when any cache holds the answer and costly only on the first lookup. That is why the cold medians in the TL;DR hide it. MDN's guide puts it simply: after the first request, the IP address "will likely be cached for a time." However, the same guide warns about mobile networks. There, each lookup travels from the phone to the cell tower and on to a name server, which "can add significant latency."
Because WARP sent every lookup through Cloudflare's network, a popular host came back in a few milliseconds. A home router or a mobile carrier's resolver will show its own numbers. So run the test from the network you care about.
Why do TCP and TLS cost two round trips?#
TCP needs one round trip and TLS 1.3 one more before the request leaves, which cost 48.7 ms for atyantik.com and 206.4 ms for www.wikipedia.org in our 7 October 2026 test. Here, a round trip is one message out to the server and one back.
Show data table
| Item | Value |
|---|---|
| atyantik.com | 48.7 ms |
| example.com | 55.1 ms |
| www.wikipedia.org | 206.4 ms |
| developer.mozilla.org | 70 ms |
| github.com | 77.6 ms |
Both handshakes together cost 48.7 ms for atyantik.com and 206.4 ms for www.wikipedia.org.
First, TCP opens with three messages, which MDN's guide calls SYN, SYN-ACK and ACK. Then TLS agrees the keys and checks the server. Under RFC 8446, the IETF's TLS 1.3 standard from August 2018, a full handshake takes one round trip. Also, a resumed session can send some early data with zero round trips.
Handshake cost grows with the distance to the server. For example, www.wikipedia.org needed 206.4 ms for both handshakes in our 7 October 2026 test, while atyantik.com needed 48.7 ms. Since the likely cause is distance to the server, a nearby edge server shrinks both phases.
However, HTTP/3 goes further, because it runs over QUIC, a newer transport built on UDP. The IETF's QUIC standard, RFC 9000 from May 2021, says QUIC uses "a combined cryptographic and transport handshake to minimize connection establishment latency." In short, the TCP and TLS steps fold into one. Every transfer in our test used HTTP/2 over TCP, so the chart shows both handshakes.
What happens after the request leaves the browser?#
After the request leaves, the server works and the reply travels back, which our 7 October 2026 test timed at 93.6 ms in all for example.com and 496.0 ms for www.wikipedia.org. As a result, the whole HTML response on a new connection varied widely from site to site:
Show data table
| Item | Value |
|---|---|
| atyantik.com | 170.5 ms |
| example.com | 93.6 ms |
| www.wikipedia.org | 496 ms |
| developer.mozilla.org | 166 ms |
| github.com | 379 ms |
The whole HTML on a new connection took 93.6 ms for example.com and 496.0 ms for www.wikipedia.org.
The request itself is short, since it holds only a method such as GET, the path and query, and headers, as RFC 9110 defines them. Then the server works out the reply. In our 7 October 2026 test, that wait was 38.6 ms for atyantik.com, and then the bytes streamed back. A small page like example.com arrives in under a millisecond, while a large one keeps the line busy for longer.
However, the network total is only the start. Once the first chunk lands, MDN's guide says the browser begins "parsing the information received". It builds the DOM and CSSOM, the trees that hold the page's structure and styles. Then it runs style, layout, paint and, in some cases, compositing.
Meanwhile, every script, font and image the HTML names starts its own request. Often, that request goes to a new host, with its own DNS lookup and handshake. As a result, the page you see can take far longer than the HTML did.
Which documentation do you need to trace your own URL?#
Three pages cover it: the curl manual for the timing variables, MDN's URL API for the parts, and MDN's how browsers work guide for the render path. Read them in this order, since each one builds on the last:
- The curl manual, for the
-wwrite-out variables. It definestime_namelookup,time_connect,time_appconnect,time_starttransferandtime_total, each in seconds "from the start". - The URL interface on MDN, for
new URL()and the properties that split an address into its parts. - MDN's how browsers work, for everything after the first byte: parsing, style, layout, paint and compositing.
Each curl variable counts from the same start, so the values grow as the transfer goes on. For example, the manual defines time_appconnect as the time "from the start until the SSL/SSH/etc connect/handshake to the remote host was completed." So the TLS phase alone is that value minus time_connect.
How do you time your own URL with curl?#
One curl command with a write-out format prints all five timings, and fetching the URL twice in one command shows the warm connection beside the cold one. These four steps repeat our test for any URL:
# 1. The write-out format: five cumulative timings from the curl manual, in seconds
FMT='dns %{time_namelookup}  tcp %{time_connect}  tls %{time_appconnect}  first-byte %{time_starttransfer}  total %{time_total}\n'

# 2. Cold: a fresh curl process opens a new connection
curl -s -o /dev/null -w "$FMT" https://atyantik.com/

# 3. Warm: the same URL twice in one process; the second line reuses the connection
curl -s -o /dev/null -w "$FMT" https://atyantik.com/ -o /dev/null https://atyantik.com/

# 4. Each phase in milliseconds: subtract each timing from the next
curl -s -o /dev/null -w '%{time_namelookup} %{time_connect} %{time_appconnect} %{time_starttransfer} %{time_total}\n' https://atyantik.com/ |
  awk '{printf "dns %.1f tcp %.1f tls %.1f wait %.1f download %.1f ms\n", $1*1000, ($2-$1)*1000, ($3-$2)*1000, ($4-$3)*1000, ($5-$4)*1000}'
Run step 2 several times and take the median, since one round can mislead. In our test, one cold github.com round spent more than a second on TCP alone. However, its other cold rounds took well under a tenth of that. Also, the operating system caches DNS answers, so only your first run shows an uncached lookup.
When is a curl timing the wrong tool?#
A curl timing measures one HTML response from one machine, so it misses rendering, scripts, images and what a phone on mobile data sees. Use it for the network phases, and pick another tool for the rest.
- For render time, open the Performance panel in your browser's developer tools. It shows parsing, layout and paint, which curl never does.
- For real phones and laptops, use field data such as Core Web Vitals. A curl run from one desk says little about a phone on a slow network in another country, and ours also went through a WARP tunnel.
- For a page with many hosts, use the browser's Network panel. Curl fetches one URL, while a page often pulls dozens.
In short, curl tells you where the first byte went. It cannot tell you how the page felt.
Where should you go next?#
Read what Core Web Vitals measure after the render, how an HTTP/2 server answers, and what belongs at the edge to shorten the handshake. The Core Web Vitals guide picks up where curl stops, at what shows on screen. Then the Node.js HTTP/2 server post shows the server side of every reply in our test. For a server that still speaks HTTP/1.1, the Node.js HTTP/1.1 server post shows how keep-alive holds one connection open between replies. Also, the post on what belongs at the edge explains why a nearby edge cuts the handshake phases. When first byte times need measuring and fixing across a whole site, that is web performance work. Moving that setup to the edge falls under Cloudflare development. Still, the curl manual and a few quiet runs are enough to trace your own URL today.