Lighthouse performance score explained: how the scoring model works
Five lab numbers go in and one score comes out. Once you can redo that sum by hand, you know which metric holds your missing points and why the number moves when nothing changed.
How is the Lighthouse performance score calculated?#
Lighthouse maps five lab metrics onto 0 to 1 scores and takes their weighted mean, with Total Blocking Time at 30 percent in the GoogleChrome Lighthouse source as of October 2026. The Chrome scoring docs list the same Lighthouse 10 weights. Also, they say the metric scores "are not visible in the report". So the report shows raw values, and the scores sit under the hood.
Show data table
| Segment | Value (%) | Share |
|---|---|---|
| Total Blocking Time | 30 | 30% |
| Largest Contentful Paint | 25 | 25% |
| Cumulative Layout Shift | 25 | 25% |
| First Contentful Paint and Speed Index (10 each) | 20 | 20% |
TBT and LCP together carry more than half of the score.
In short, TBT and LCP together carry more than half of the score, so they decide most of what you see.
Why does the weighting decide which fix ships first?#
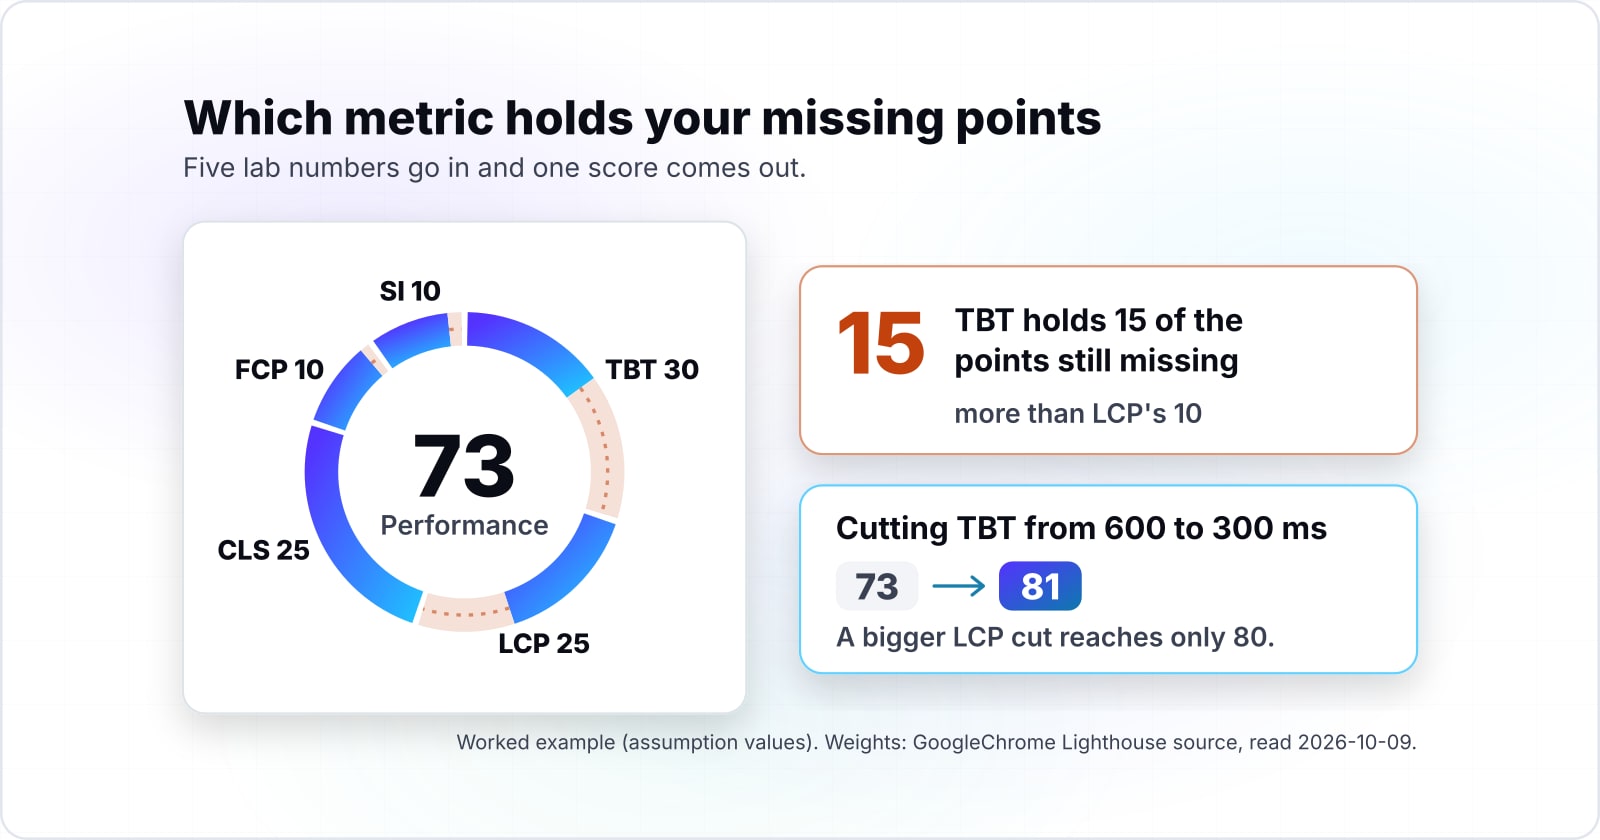
In the worked example, cutting TBT from 600 to 300 ms lifts the score from 73 to 81, while a larger LCP cut reaches only 80. Because the weights and the curve slopes differ, a week of work buys a different gain on each metric. So picking the metric is the real decision, and the size of the fix comes second.
Show data table
| Item | Value |
|---|---|
| the run as measured | 73 |
| TBT cut from 600 to 300 ms | 81 |
| LCP cut from 3630 to 2500 ms | 80 |
| both fixes | 89 |
| the same raw values on desktop curves | 42 |
The TBT cut moves the score more than the bigger LCP cut.
In practice, TBT falls when less JavaScript runs on the main thread during load. In particular, your rendering choices on Cloudflare or elsewhere decide much of that. Meanwhile, a slow server response delays both FCP and LCP. Common MySQL bottlenecks are a frequent cause of that delay.
How does a raw metric value become a 0 to 1 score?#
Each metric has two control points in the GoogleChrome Lighthouse source as of October 2026, the value scoring 0.90 and the value scoring 0.50, such as 2500 and 4000 ms for mobile LCP. In the Chrome scoring docs, the 8th percentile of HTTP Archive data "becomes a score of 90 (the good/green control point)". Likewise, the 25th percentile becomes the median control point at 50.
Those two points fix a log-normal curve, and any raw value can then be read off it. Lighthouse's getLogNormalScore function in statistics.js does that step. Then computeLogNormalScore in util.js adds a small boost above 0.90 and rounds each score down to two decimals.
| metric | value that scores 0.90 (p10) | value that scores 0.50 (median) |
|---|---|---|
| FCP | 1800 | 3000 |
| Speed Index | 3387 | 5800 |
| LCP | 2500 | 4000 |
| TBT | 200 | 600 |
| CLS | 0.1 | 0.25 |
As a result, a metric at its 0.90 point is good, while a metric at its 0.50 point is only average.
What does one mobile run look like, worked through?#
In this worked example (assumption values), FCP 1800 ms, SI 3700 ms, LCP 3630 ms, TBT 600 ms and CLS 0.02 score 0.90, 0.85, 0.60, 0.50 and 1.00, for 73. The table below multiplies each score by its weight. Then the arithmeticMean function in Lighthouse's scoring.js divides by the total weight and rounds the result to two decimals.
| metric | raw value (assumption) | metric score | weight | points |
|---|---|---|---|---|
| FCP | 1800 ms | 0.90 | 10 | 9.0 |
| SI | 3700 ms | 0.85 | 10 | 8.5 |
| LCP | 3630 ms | 0.60 | 25 | 15.0 |
| TBT | 600 ms | 0.50 | 30 | 15.0 |
| CLS | 0.02 | 1.00 | 25 | 25.0 |
Illustrative: assumption raw values, scored with the GoogleChrome Lighthouse code read 2026-10-09.
Show data table
| Step | Change | Running total |
|---|---|---|
| 0 | 0 points | 0 points |
| FCP | 9 points | 9 points |
| SI | 8.5 points | 17.5 points |
| LCP | 15 points | 32.5 points |
| TBT | 15 points | 47.5 points |
| CLS | 25 points | 72.5 points |
| Total points | 72.5 points |
The five weighted scores add up to 72.5 points, which the report prints as 73.
The points add to 72.5, so the mean is 0.725. That rounds to 0.73, and the report prints it as 73. Therefore, you can check any report the same way, because it already shows every raw value you need.
Show data table
| Item | Value |
|---|---|
| First Contentful Paint | 0.9 |
| Speed Index | 0.85 |
| Largest Contentful Paint | 0.6 |
| Total Blocking Time | 0.5 |
| Cumulative Layout Shift | 1 |
TBT at 0.50 and LCP at 0.60 are the two scores pulling the total down.
Which metric should you fix first?#
In the worked example, Total Blocking Time holds 15 of the points still missing, more than LCP's 10 and the other three metrics combined. The rule is short: the points left on a metric are one minus its score, times its weight. For example, TBT at 0.50 with weight 30 leaves 15 points on the table.
Drag each metric sub-score. The composite recomputes live.
TBT has the most points still on the table. It carries 15 unearned points at a 30% weight, more than any other metric on the page. Raising a metric that already sits near 1.00 adds almost nothing, so spend the effort where the weight and the gap are both large.
| Metric | Weight | Sub-score | Points earned | Points available |
|---|---|---|---|---|
| FCP | 10% | 0.9 | 9 | 1 |
| SI | 10% | 0.85 | 8.5 | 1.5 |
| LCP | 25% | 0.6 | 15 | 10 |
| TBT | 30% | 0.5 | 15 | 15 |
| CLS | 25% | 1 | 25 | 0 |
| Total | 100% | 73 | 27 |
An illustrative teaching model, not a benchmark. The weights are the published current Lighthouse 10 to 13 bundle (FCP 10%, Speed Index 10%, LCP 25%, TBT 30%, CLS 25%); each sub-score maps from a raw metric value through a log-normal curve, which this composer takes as its input rather than recomputing. Real scores depend on your throttling mode and run-to-run variance, so read the median of several runs under a fixed device and network preset before you trust a number.
Then sort your own metrics by that number. The top row names the first fix, whatever the colours in the report suggest.
Why does the Lighthouse score change between runs?#
On Lighthouse's mobile TBT curve as of October 2026, for example, 300 ms scores 0.79 and 400 ms scores 0.68, so small main-thread noise moves the total. On that curve, an extra tenth of a second of blocking costs about 3 points at a 30 percent weight. Because the middle of each curve is steep, small noise lands as visible points.
Show data table
| Stage | Value |
|---|---|
| 0 ms | 1 |
| 100 ms | 0.98 |
| 200 ms | 0.9 |
| 300 ms | 0.79 |
| 400 ms | 0.68 |
| 500 ms | 0.58 |
| 600 ms | 0.5 |
| 700 ms | 0.42 |
| 800 ms | 0.36 |
| 900 ms | 0.31 |
| 1000 ms | 0.27 |
| 1100 ms | 0.23 |
| 1200 ms | 0.2 |
Between 300 and 400 ms the score falls from 0.79 to 0.68, so small noise shows.
Google's variability guide names where the noise comes from: local networks, web servers, client hardware, other apps on the machine and the browser itself. For that reason, it gives one rule: "The median Lighthouse score of 5 runs is twice as stable as 1 run." So to monitor Lighthouse scores over time, compare medians and treat a gap of a few points as noise.
Why do mobile and desktop score the same page differently?#
Desktop runs use their own curves, so the worked example's raw values that score 73 on mobile curves score 42 on desktop, where LCP reaches 0.90 at 1200 ms. In the GoogleChrome Lighthouse source as of October 2026, every desktop control point is tighter than its mobile one, apart from CLS. The Chrome scoring docs give the history. Before Lighthouse v6, desktop runs used the mobile curves, which "led to artificially inflated desktop scores".
| metric | value that scores 0.90 (p10) | value that scores 0.50 (median) |
|---|---|---|
| FCP | 934 | 1600 |
| Speed Index | 1311 | 2300 |
| LCP | 1200 | 2400 |
| TBT | 150 | 350 |
| CLS | 0.1 | 0.25 |
73
Mobile curves
42
Desktop curves
The same five raw values score far lower on the tighter desktop curves.
| Option | Performance score, 0 to 100 (assumption values) |
|---|---|
| Mobile curves | 73 |
| Desktop curves | 42 |
In short, a mobile score and a desktop score are two different tests. Compare each one only with itself.
What does a lab run simulate, and why does field data disagree?#
A default mobile lab run in the Lighthouse throttling docs, read October 2026, simulates 150 ms latency, 1.6 Mbps down and a 4x CPU slowdown on one device. The throttling docs also set 750 Kbps up. In short, that is one device on one network, every time.
| Item | as printed per setting |
|---|---|
| round-trip latency (ms) | 150 |
| download throughput (Mbps) | 1.6 |
| upload throughput (Kbps) | 750 |
| CPU slowdown multiplier | 4 |
Field data is the opposite, since it comes from real people on real devices. In web.dev's lab and field article, last updated 2022-07-18, CrUX shows real Chrome users "over a 28-day period". By contrast, a lab report will "return the same LCP element every single time", the article says, while real users see different ones. Also, TBT is only a lab stand-in for Interaction to Next Paint (INP), which needs real clicks and taps.
Which Lighthouse pages do you build a score gate from?#
Build a score gate from three GoogleChrome pages read in October 2026, the scoring docs, the variability guide and the Lighthouse CI configuration reference. Read them in this order:
- Lighthouse performance scoring: the weights and the colour bands your threshold is set against.
- Score variability: judge the median of 5 runs, not one run.
- Lighthouse CI configuration:
numberOfRuns, theassertblock and its aggregation methods.
Also pin the Lighthouse version. In Lighthouse 8, the same scoring docs list Time to Interactive at 10 percent and CLS at 15 percent. As a result, a version bump can move the score with no code change.
Show data table
| Dimension | Lighthouse 8 | Lighthouse 10 |
|---|---|---|
| FCP | 10% | 10% |
| SI | 10% | 10% |
| LCP | 25% | 25% |
| TBT | 30% | 30% |
| CLS | 15% | 25% |
Between Lighthouse 8 and 10, CLS rose from 15 to 25 percent of the score.
What is a good score, and how do you gate it in CI?#
Chrome for Developers marks 90 to 100 (green) as good and 50 to 89 (orange) as needing improvement, in its scoring docs last updated 2019-09-19. Anything from 0 to 49 is poor. Since one run is noisy, the gate below asserts 0.9 on the most typical of five runs. The Lighthouse CI docs call that method median-run.
Show data table
| Measure | Value | Target | Range |
|---|---|---|---|
| Worked example, mobile | 73 score | 90 score | 0 score to 100 score |
The worked example's 73 sits in the orange band, below the green edge at 90.
// lighthouserc.js: collect five runs, then assert on the representative one
module.exports = {
  ci: {
    collect: {
      staticDistDir: './dist',
      numberOfRuns: 5,
    },
    assert: {
      assertions: {
        'categories:performance': ['error', {minScore: 0.9, aggregationMethod: 'median-run'}],
      },
    },
    upload: {
      target: 'temporary-public-storage',
    },
  },
};# with the Lighthouse CI command-line tool installed, from the folder holding lighthouserc.js
lhci autorunFirst, lhci autorun runs collect, assert and upload in turn. Then the error level fails the pull request below 90. Also add a budget, because an assertion judges a score while a budget judges resource sizes and request counts. For instance, a bundle can grow while the rounded score still reads green.
When not to chase a higher Lighthouse score?#
Past a score near 0.96 each point costs more, and the Chrome scoring docs, last updated 2019-09-19, say 99 to 100 takes the metric gain of 90 to 94. The same page calls a perfect 100 "extremely challenging to achieve and not expected". Three cases call for a different tool:
- Your metrics already sit past the knee of the curve. Instead of another lab point, spend the time on field monitoring.
- Your field data already passes Core Web Vitals. Then real users are fine, and the lab score is a diagnostic, not a goal.
- You want to compare your site with a rival's. Instead, compare field metrics, because Lighthouse scores from different runs and versions do not line up.
Show data table
| Stage | Value |
|---|---|
| 1000 ms | 1 |
| 1500 ms | 1 |
| 2000 ms | 0.97 |
| 2500 ms | 0.9 |
| 3000 ms | 0.78 |
| 3500 ms | 0.64 |
| 4000 ms | 0.5 |
| 4500 ms | 0.37 |
| 5000 ms | 0.27 |
| 5500 ms | 0.19 |
| 6000 ms | 0.13 |
Near the top the curve flattens, so each extra point costs more work.
What should you measure after the lab score?#
Core Web Vitals judge field data at the 75th percentile, with good LCP within 2.5 seconds per web.dev, last updated 2024-10-31, so measure that next. The same Web Vitals page sets good INP at 200 milliseconds or less and good CLS at 0.1 or less.
| Item | good threshold at the 75th percentile of page loads |
|---|---|
| LCP (seconds) | 2.5 |
| INP (milliseconds) | 200 |
| CLS (unitless) | 0.1 |
For what each metric measures, read what Web Vitals are. Then the site optimization guide for 2026 picks up the field side of speed work. If a team wants the metrics fixed, our web performance work covers it. Likewise, our CI and CD pipeline work covers wiring the gate. Even so, the three Google pages above are enough on their own to rebuild every number here.