How to fix MySQL performance bottlenecks and slow MySQL queries in production
Most slow MySQL servers are not short of memory. They run one cheap query far too often, or scan a table an index should cover, and the server already records both.
How do you fix MySQL performance bottlenecks, and which are the most common?#
The most common MySQL performance bottlenecks are a few statements eating most server time, missing indexes, stale statistics, a small buffer pool, lock waits and connection limits, fixed in that order.
Oracle's MySQL 8.4 Reference Manual, accessed 1 October 2026, opens its tuning chapter with "System bottlenecks". Every item above ends up there. Still, the list is not the hard part. Instead, the hard part is the order, because each fix changes what the next check shows.
So check them in this order:
- Step 1
Rank statements by total time, from the slow query log or the sys schema.
- Step 2
Read the plan of the top statement with EXPLAIN ANALYZE.
- Step 3
Add the missing index, or fix the column order of the one you have.
- Step 4
Refresh statistics with ANALYZE TABLE when the estimate and the real row count disagree.
- Step 5
Size the buffer pool and the redo log for the host.
- Step 6
Find lock waits, then decide whether the connection limit is real.
In practice, steps 1 to 4 fix most slow servers. Memory comes late, because a missing index makes every pool look too small. So the way to fix MySQL performance bottlenecks is to start with the statements, not the settings.
Why does total time decide which query to fix first?#
In a modelled example, a 3 ms lookup run 400,000 times an hour costs 1,200 seconds of server time, more than six times a 6 second report run 30 times.
Server time saved is execution count times average latency. So the fix worth reporting upward is usually on a fast query that runs all day. In this modelled example, 3 ms times 400,000 runs is 1,200,000 ms an hour, which is 1,200 seconds. Then the report: 6 seconds times 30 runs is 180 seconds.
The slow report feels worse, because someone waits for it. However, the fast lookup costs more because it never stops. Say you cut the lookup from 3 ms to 1 ms; that gives back 800 seconds an hour. As a result, one small index beats a full rewrite of the report.
Which statement costs more server time?
Set the average latency and the runs per hour for a fast lookup and a slow report. Defaults are the modelled example, not a measurement.
Lookup: server seconds per hour
1,200
- Report: server seconds per hour
- 180
- Lookup cost as a multiple of the report (above 1, fix the lookup first)
- 6.7
At the defaults the lookup costs 1,200 seconds against 180, so the lookup is fixed first.
The variable that changes the answer is the fast query's run count. For instance, at 40,000 runs an hour the same lookup costs 120 seconds, so the report wins. Since the count moves with traffic, rank on a busy hour, not a quiet one.
How do you fix slow MySQL queries?#
To fix slow MySQL queries, turn on the slow query log, group it with mysqldumpslow by total time, explain the top statement, then add the index its WHERE clause needs.
First, measure. The manual's slow query log page says the log is off by default and records statements slower than long_query_time seconds. Also, "the minimum and default values of long_query_time are 0 and 10". So a 3 ms lookup never reaches the log. Lower the threshold for a busy hour, then raise it again.
Second, group the file by statement shape. In the manual's words, mysqldumpslow "parses MySQL slow query log" files and summarizes them. Queries that differ only in their values share one line. However, it sorts by average time by default, so pass -s t to sort by total time.
In the manual's own example log, the statement with the slowest single run is not the one with the most total time.
Show data table
| Item | Value |
|---|---|
| insert into t2 select * from t1 (Count 1, Time 4.32s) | 4 |
| insert into t2 select * from t1 limit N (Count 3, Time 2.53s) | 7 |
| insert into t1 select * from t1 (Count 3, Time 2.13s) | 6 |
The slowest single run is not the largest total: the 2.53 second insert ran three times for 7 seconds.
With no log file, the sys schema gives the same ranking. Its statement_analysis view reads the Performance Schema digest table, where "the digesting process converts each SQL statement to normalized form". By default, "rows are sorted by descending total latency".
Then explain the top statement and fix what the plan shows. For a slow SELECT, the manual says "the first thing to check is whether you can add an index". It also says to keep statistics current with ANALYZE TABLE. After the fix, re-rank and take the next statement.
Is the database really the bottleneck?#
The MySQL 8.4 manual traces system bottlenecks to four sources: disk seeks, disk reading and writing, CPU cycles and memory bandwidth.
Under CPU cycles, having large tables compared to memory "is the most common limiting factor", in the manual's words. It also notes that with small tables, speed is usually not the problem. Therefore, a slow page on small tables often points away from the server itself.
A server still on the shipped memory defaults is a different problem from a statement doing too much work.
134217728
innodb_buffer_pool_size default
104857600
innodb_redo_log_capacity default
A production server that still reports these values has never been sized for its host.
| Option | bytes |
|---|---|
| innodb_buffer_pool_size default | 134217728 |
| innodb_redo_log_capacity default | 104857600 |
So, before changing MySQL, confirm the time is spent inside the server. Compare application request time with statement latency, because a slow page is often many fast queries. For example, say a page takes 900 ms but spends 40 ms in SQL; the problem is in the app. Meanwhile, a page that runs, say, 300 tiny queries is a code problem, even at a millisecond each.
Also, check the host, since a busy disk, full CPU or swapping server slows every query. In short, when every statement got slower on the same day, look at the machine. When only one statement got slower, look at that statement.
How do you read EXPLAIN ANALYZE to find a missing index?#
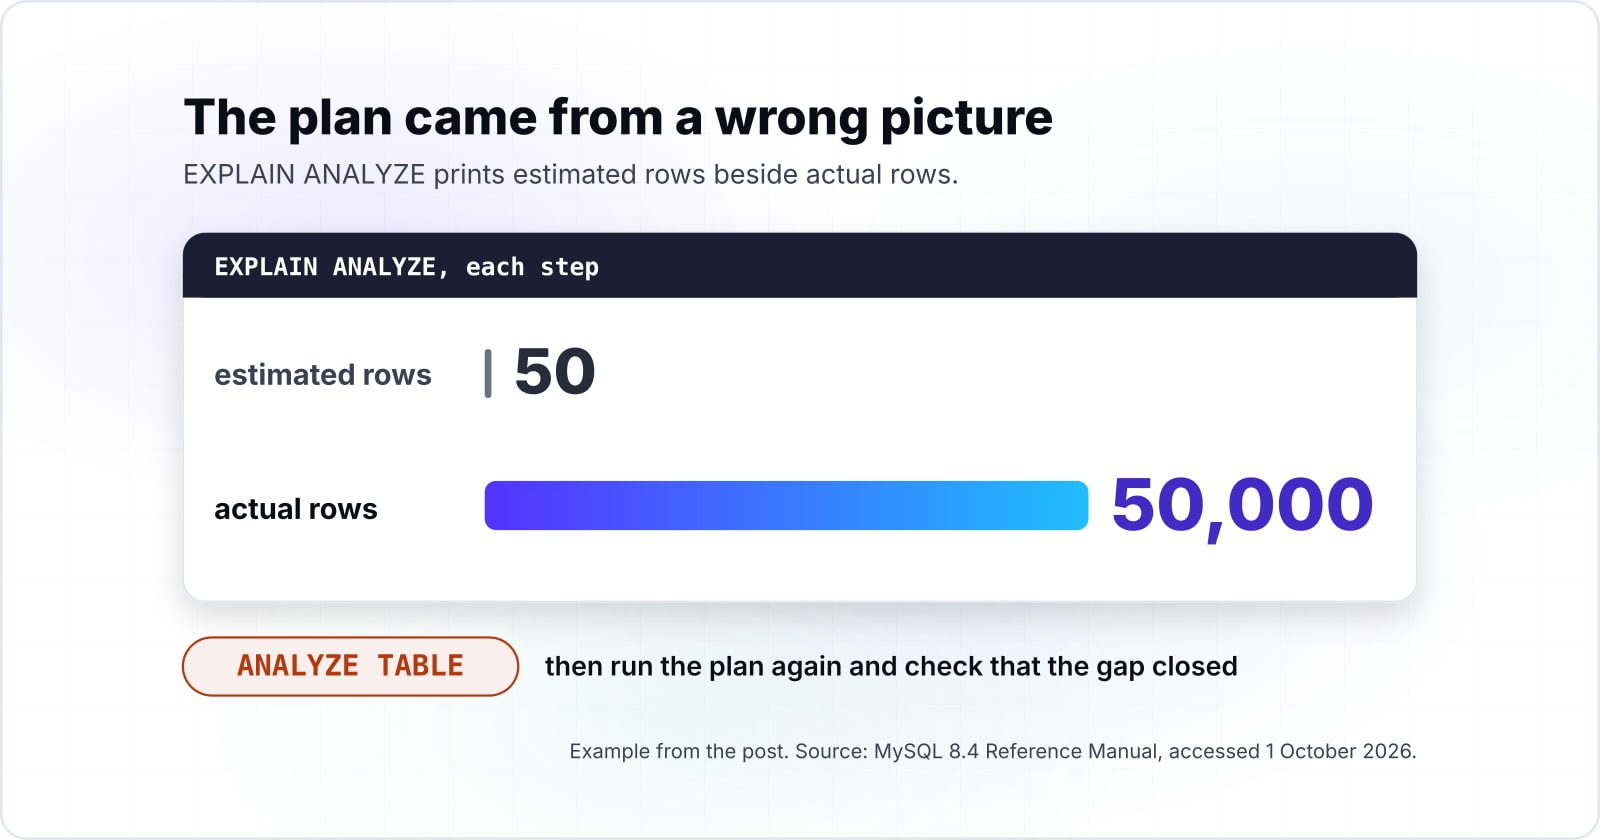
EXPLAIN ANALYZE runs the statement and prints estimated rows beside actual rows for each step, so a large gap points at a missing index or stale statistics.
In the manual's words, "EXPLAIN ANALYZE runs a statement and produces" the plan along with timing. For each step it prints the estimated cost and rows. It also prints the time to the first row, the time spent, the rows returned and the loop count. Because it really runs the query, run a heavy one at a quiet hour.
A type of ALL on a large table means a missing index. An estimate far from the actual row count means statistics ANALYZE TABLE should refresh. Plain EXPLAIN shows the access type for each table. From best to worst, the main values are system, const, eq_ref, ref, range, index and ALL. The manual calls ALL a full table scan and adds, "you can avoid ALL by adding indexes".
Then compare the two row counts on each step. Say the estimate is 50 rows and the real run returns 50,000; the plan came from a wrong picture. In that case, ANALYZE TABLE "performs a key distribution analysis and stores the distribution" for the table. After that, run the plan again and check that the gap closed.
Why does column order matter in a composite index?#
MySQL can use a multiple-column index only through a leftmost prefix of its columns, so an index on (a, b) serves a filter on a but not on b alone.
The manual is direct: "If the table has a multiple-column index, any leftmost prefix of the index can be used by the optimizer". For example, its own index on (col1, col2, col3) helps searches on col1, on col1 and col2, and on all three. However, a filter on col2 alone cannot use it.
| Filter on | Leftmost prefix? | Uses the index? |
|---|---|---|
| col1 | Yes | Yes |
| col1 and col2 | Yes | Yes |
| col1, col2 and col3 | Yes | Yes |
| col2 alone | No | No |
So order a composite index by the columns every query filters on first, then put range or sort columns after them. For instance, a query that filters on customer_id and sorts by created_at wants an index on (customer_id, created_at), in that order. The reverse order forces a scan of every date.
Unused indexes are the other half, so drop the ones the sys schema shows unused. Its schema_unused_indexes view lists indexes with no recorded use. The manual warns that the view "is most useful when the server has been up and processing long enough that its workload is representative". So read it after a full business cycle, because a monthly report may need an index unused this week.
How big should the InnoDB buffer pool be?#
On a dedicated server MySQL 8.4 sizes the buffer pool at half of memory from 1GB to 4GB and three quarters above 4GB, so 16 GB gets 12 GB.
In the manual's words, "The buffer pool is an area in main memory where InnoDB caches table and index data as it is accessed." InnoDB is the storage engine MySQL uses by default. A read served from the pool skips the disk, so its size decides how much of the working set stays fast.
Size the pool from the manual's dedicated-server rule. Shrink it when the host runs anything else, because the 128MB default suits a laptop, not production. The rule comes from Table 17.8 in the MySQL 8.4 manual, under the --innodb-dedicated-server option.
Show data table
| Item | Value |
|---|---|
| 2 GB server | 1 |
| 4 GB server | 2 |
| 8 GB server | 6 |
| 16 GB server | 12 |
| 32 GB server | 24 |
| 64 GB server | 48 |
Above 4 GB of memory the pool takes three quarters of the server, so 16 GB gets 12 GB.
The same page says the option "is not recommended if the MySQL instance shares system resources with other applications". So a host that also runs the app server needs a smaller pool. Elsewhere, the manual notes that "up to 80% of physical memory is often assigned to the buffer pool" on dedicated servers. Also, the pool can be resized "while the server is running", so a change needs no restart.
When do writes become the bottleneck instead of reads?#
MySQL 8.4 sizes redo log capacity on a dedicated server at half a gigabyte per logical processor, capped at 16 GB, so 32 processors reach the cap.
Meanwhile, the redo log is the write side. The manual says innodb_redo_log_capacity "defines the amount of disk space occupied by redo log files". Its default is 104857600 bytes on the same InnoDB variables list.
Once reads are fixed, a write-heavy server can outgrow that default. The dedicated-server rule then shows the size MySQL would pick for its processor count. The manual gives it as "(number of available logical processors / 2) GB, with a maximum dynamic default value of 16 GB".
Show data table
| Stage | Value |
|---|---|
| 4 logical processors | 2 |
| 8 logical processors | 4 |
| 16 logical processors | 8 |
| 32 logical processors | 16 |
| 64 logical processors | 16 |
Half a gigabyte per logical processor until 32 processors, where the 16 GB cap holds the line flat.
In practice, check reads first. A scan that an index would remove also holds locks longer and does far more work. Once the scans are gone, give more redo log space to a server that still stalls on writes.
How do you find which transaction is blocking another?#
The sys schema's innodb_lock_waits view pairs each waiting transaction with the one blocking it, read from the Performance Schema data_lock_waits table.
Each row names the waiting_query and the blocking_query, with a blocking_pid for the blocking session. As a result, you see the statement holding the lock and the one stuck behind it.
So name the blocker first, then shorten the transaction that holds the lock. Treat the innodb_lock_wait_timeout default as a ceiling, not a target. The manual sets it at 50 seconds, the time a transaction "waits for a row lock before giving up". Therefore, raising it only makes the queue longer.
The fix is usually a shorter transaction. The manual advises to "keep transactions that insert or update data small enough that they do not stay open for long periods of time". It also warns that "on high concurrency systems, deadlock detection can cause a slowdown when numerous threads wait for the same lock". In that case, the innodb_deadlock_detect variable can turn detection off, and the lock wait timeout then rolls the transaction back.
Which MySQL 8.4 manual pages do you work from?#
Eight MySQL 8.4 manual pages cover the whole triage in order, from the slow query log to the dedicated-server sizing table and innodb_lock_waits.
Work from them in triage order, so each page answers the question the last one raised:
- The slow query log: how to turn it on, and the long_query_time threshold.
- mysqldumpslow: grouping the log by statement shape, and the
-s tsort by total time. - The statement_analysis view: the same ranking without a log file, by
total_latency. - The EXPLAIN statement: the
EXPLAIN ANALYZEsyntax and what each step prints. - Optimizing SELECT statements: an index on the WHERE columns as the first check.
- Multiple-column indexes: the leftmost prefix rule.
- Automatic InnoDB configuration for a dedicated server: the sizing table for the pool and the redo log.
- The innodb_lock_waits view: the waiting and blocking pairs.
Each page is short, so read them in this order, since each one assumes the fix before it is done.
What is the smallest diagnostic script to run first?#
Four read-only SQL statements run the whole triage: rank by total latency, explain the top statement, list lock waits, and compare memory settings with the shipped defaults.
First, select the top rows of sys.statement_analysis by total_latency, then run EXPLAIN ANALYZE on the first one. Next, select from sys.innodb_lock_waits. Finally, read the memory variables and compare them with the defaults the server shipped with. Run it all in one client session:
-- 1. The ten statements costing the most total time
SELECT query, exec_count, avg_latency, total_latency, full_scan
FROM sys.statement_analysis
ORDER BY total_latency DESC
LIMIT 10;

-- 2. The plan of the top statement (paste a literal example; this runs it)
EXPLAIN ANALYZE
SELECT id, status FROM orders
WHERE customer_id = 42
ORDER BY created_at DESC
LIMIT 20;

-- 3. Who is blocking whom right now
SELECT waiting_pid, waiting_query, blocking_pid, blocking_query
FROM sys.innodb_lock_waits;

-- 4. Memory and connection settings against the shipped defaults
SHOW VARIABLES WHERE Variable_name IN
  ('innodb_buffer_pool_size', 'innodb_redo_log_capacity', 'max_connections');
Step 2 uses an example orders table, so swap in the statement that topped step 1. Then compare step 4 with the defaults the manual lists, the same values charted under the bottleneck check above.
When is raising max_connections the wrong tool?#
MySQL allows 151 connections by default and up to 100000, but past the open files limit each extra connection only queues more work on the same CPUs.
Oracle's MySQL 8.4 manual, accessed 1 October 2026, lists max_connections with a default of 151 and a maximum of 100000. It adds that the real ceiling is "the lesser of the effective value of open_files_limit - 810" and the value you set. Also, the server permits max_connections + 1 connections. The extra one is for accounts with the CONNECTION_ADMIN privilege, so an admin can still get in.
151
max_connections default
100000
max_connections maximum
The setting can go far higher than the default, but the effective limit is the lesser of the setting and open_files_limit minus 810.
| Option | client connections |
|---|---|
| max_connections default | 151 |
| max_connections maximum | 100000 |
Source: MySQL 8.4 Reference Manual (Oracle), Server System Variables, accessed 1 October 2026
When connections run out because each request holds one too long, a pool or shorter transactions fix it. Likewise, a read load past one server needs caching or replicas, not more tuning. So here are three cases where tuning MySQL is the wrong tool:
- Every request opens its own connection. Instead, put a connection pool in the app or a proxy in front of the server, so a few connections serve many requests.
- The same rows are read thousands of times a minute. In that case, a cache in front of the database removes the reads. No index can match that.
- One server cannot carry the read load at all. Then add read replicas and send reports to them, since a bigger my.cnf will not add CPUs.
Where should you go next?#
The triage above fixes the database; the application around it, from N+1 queries to background jobs, decides how many statements reach MySQL at all.
After the database, the next gains sit in the app layer and in moving heavy work out of the request path. For Laravel apps, our guide to Laravel performance covers eager loading and the N+1 pattern that inflates run counts, and Laravel toRawSql() prints the exact statement to run EXPLAIN on. Similarly, moving heavy jobs onto queues shortens the transactions behind lock waits. For WordPress sites, the postmeta versus custom tables choice decides whether an index can help at all.
If slow pages trace back past the database, our web performance work measures the whole path. Also, if you want the server watched over time, our maintenance and support page explains how that runs.
Still, none of that is needed to start. With the manual pages and four statements above, you can fix MySQL performance bottlenecks yourself.