Laravel performance optimization: find what is slow, fix the cause, know the cost
Most Laravel speed tips are right for some app. The work is knowing which one fits yours, and a profiler and a query plan answer that faster than any list of tips can.
What is Laravel performance optimization, and where do you start?#
Laravel performance optimization, which many teams search for as Laravel speed optimization or how to improve Laravel performance, is measuring first: find the slow request in Pulse or Telescope, read its queries and EXPLAIN plan, then apply the one fix that matches the cause. The order matters more than any single tip. For example, a cache on top of an N+1 loop hides the loop for a while. But the loop is still there, and the first cache miss brings it back.
The triage runs in four steps. First, Pulse lists the requests, jobs and queries that pass a threshold, "which is 1,000ms by default" in the Laravel 13 Pulse docs, read on 3 October 2026. Second, Telescope or Debugbar replays one of those requests locally and lists every query it ran. Third, the database explains the worst query. The MySQL 8.4 reference manual, read on 3 October 2026, says "EXPLAIN ANALYZE runs a statement and produces EXPLAIN output along with timing". Finally, you apply one fix and time the same request again.
So each section below takes one cause and one fix, then gives the cost of that fix and the way it fails.
How much does one N+1 query pattern cost a Laravel page?#
A listing of 100 rows that touches one relationship runs 101 queries with lazy loading and 2 with eager loading, and every extra query is one more database round trip.
And the Laravel docs describe the same pattern: "if we have 25 books, the code above would run 26 queries", in the Eloquent relationships page. So the count is one query for the list, plus one for each row.
Atyantik's benchmark on 3 October 2026 counted it at three sizes. Lazy loading ran 26, 101 and 501 queries for 25, 100 and 500 books. With eager loading, every size ran 2.
Queries and round trips for your listing
Put in the rows your page lists and your database round trip. The query counts follow the pattern Atyantik measured on 3 October 2026; the round-trip time is your own input.
Queries with lazy loading
101
- Queries with eager loading
- 2
- Extra round-trip time per request, ms
- 99
Query counts from the Atyantik benchmark, 3 October 2026: PHP 8.2.31 CLI, illuminate/database 12.69.3, SQLite, Apple M3 Pro, three runs. Round-trip time is a model, not a measurement.
Since the benchmark used a local SQLite file, no network sat between the app and the database. Even so, 100 books took 17.2 ms with lazy loading and 10.9 ms with eager loading in that run.
Now take a modelled case, with a database server 1 ms away. Then each of the 99 extra queries costs at least one round trip. So the page waits about 99 ms more on every view. That figure is a model, not a measurement, and your own round trip may be shorter or far longer.
Because the cost grows with the rows on the page, the fix is worth most on long listings. So start with admin tables and with API endpoints that return collections.
Which tool shows what is slow: Pulse, Telescope or Debugbar?#
Use Laravel Pulse in production for slow requests, jobs and queries over a 1,000 ms default threshold, and Telescope or Debugbar locally to see every query a request runs. Each tool answers a different question, and each one has a running cost.
| Tool | Where it runs | What it shows | What it costs |
|---|---|---|---|
| Pulse | production | slow requests, jobs and queries over a threshold, grouped | storage and writes; sampling cuts the volume |
| Telescope | local | every request, query, job and cache call | a table that grows fast unless pruned |
| Debugbar | local, debug mode | one page's queries with bindings and timing | slows the page it measures |
Source: Laravel 13 Pulse and Telescope docs, read 3 October 2026; laravel-debugbar README, read 3 October 2026.
In practice, Pulse groups slow queries "based on the SQL query (without bindings) and the location where it occurred". As a result, one bad line of code shows up once, with a count. For busy apps, the Pulse docs suggest sampling, which records a share of events rather than all of them.
Then there is Telescope, the local companion. The Telescope docs show a local-only install with composer require laravel/telescope --dev. Since its table fills quickly, schedule telescope:prune, which by default means "all entries older than 24 hours will be pruned".
And Debugbar adds a bar to each page in development. Its README says it turns on when APP_DEBUG is true and the environment is not production or testing. The same README warns that it "can also slow the application down", so read its timings as relative, never absolute.
How do you fix N+1 queries in Eloquent, and what does eager loading cost?#
For Eloquent performance, this section is the fix for N+1 queries. Eager load with with() so 500 books need 2 queries instead of 501; in a measured local run that cut the listing from 48.3 ms to 16.2 ms.
The fix is one call: Book::with('author') loads every author in one extra query, per the Eloquent relationships docs.
Show data table
| Dimension | Lazy loading | with('author') |
|---|---|---|
| 25 books | 11.3 ms | 10.1 ms |
| 100 books | 17.2 ms | 10.9 ms |
| 500 books | 48.3 ms | 16.2 ms |
The gap is small at 25 rows and large at 500.
So the gap is small at 25 rows and large at 500. That matches the query counts, since each lazy query adds its own round of work.
But eager loading has a cost too. It loads every related row the query matches, whether the page reads it or not. For example, eager loading comments on a post listing pulls every comment of every post just to print a count. In that case, withCount or a select of the few columns you need is the cheaper fix. Also, eager loading a relationship the page never touches adds a query and saves none.
Two guards keep the pattern from coming back. First, Model:: makes a lazy load throw, and the Eloquent docs suggest turning it on outside production only. Second, Laravel 13 offers Model::. It eager loads a relationship for the whole collection the first time you touch it, which is handy on old code. However, it hides which queries a page runs, so an explicit with() is easier to review.
How do you read EXPLAIN in MySQL or PostgreSQL before adding an index?#
Laravel query optimization starts in the database, not in PHP. Run EXPLAIN ANALYZE on the exact SQL the slow request sent, and add an index only when the plan shows a full table scan over many more rows than it returns. Get that SQL from Telescope or Debugbar, or use toRawSql(), which prints the query with its bindings filled in, as the toRawSql post shows.
In practice, MySQL 8.4's EXPLAIN ANALYZE prints the plan as a tree with real timing beside the estimates. The MySQL manual also says to run ANALYZE TABLE when an index is not used as you expect, because that refreshes the table statistics the optimizer relies on.
In PostgreSQL, look for a "Seq Scan" node over a large table. But be careful with the ANALYZE option. The PostgreSQL manual warns that with it, "EXPLAIN actually executes the query". So wrap an UPDATE or DELETE in BEGIN and ROLLBACK before you explain it, as the manual's own example does.
But an index is not free. It speeds one read path, and every insert and update on that table then writes the index as well. So add the one index the plan asks for, then explain the query again to confirm the plan now uses it.
Should you use chunk, chunkById, lazy or cursor on a large table?#
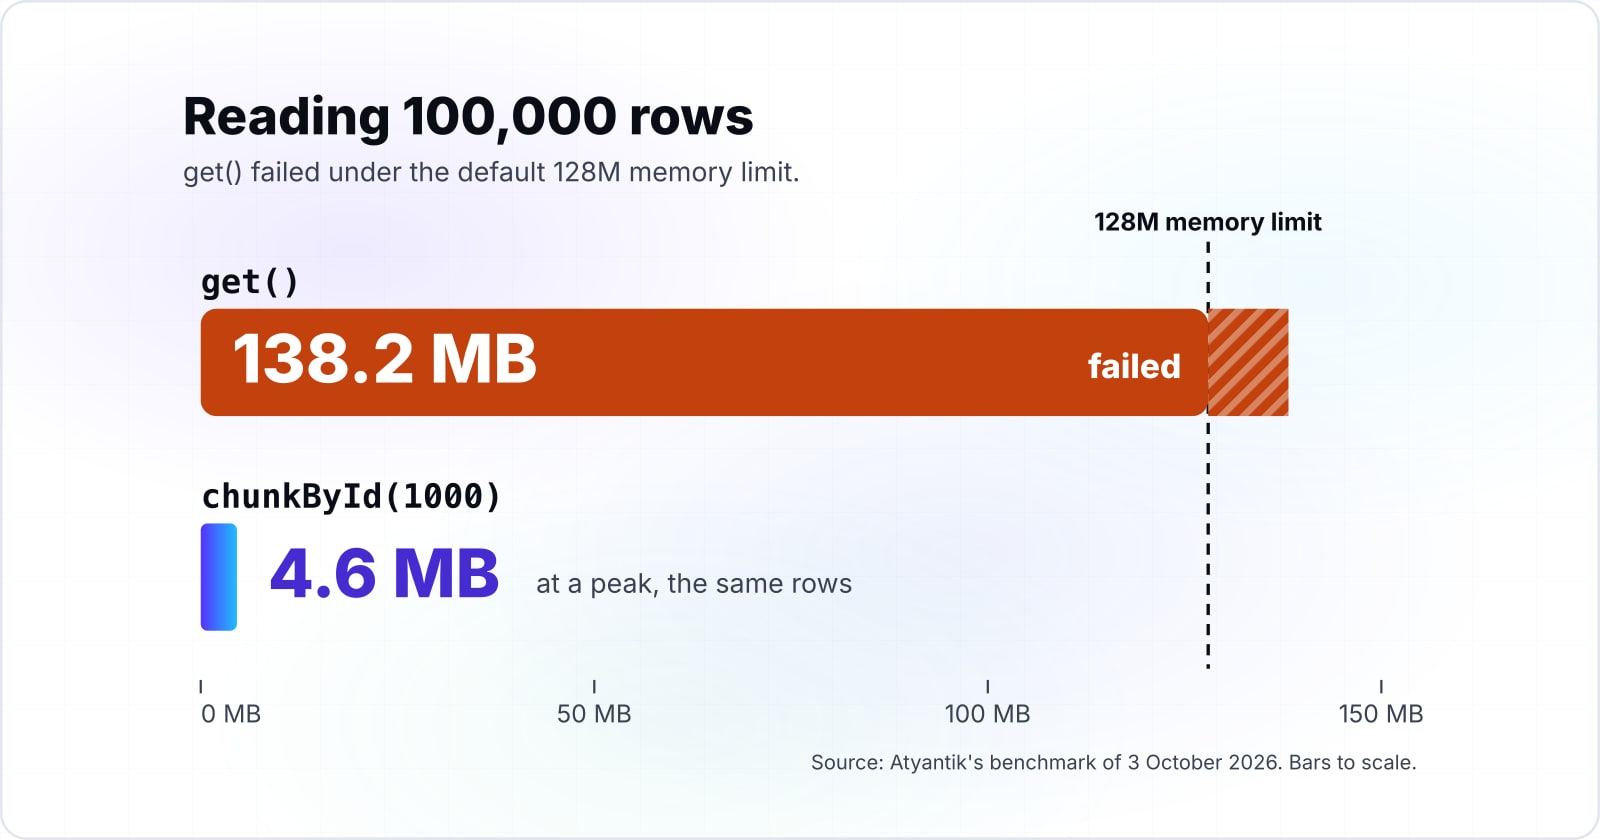
Iterating 100,000 rows with Eloquent's get() peaked at 138.2 MB and failed under the default 128M memory limit, while chunkById(1000) peaked at 4.6 MB. That is Atyantik's benchmark of 3 October 2026, and its setup is short enough to rerun.
It ran on an Apple M3 Pro laptop, from the command line. The seed was 2,000 authors and 100,000 books, each with a short text blurb. Each method ran in its own process, three times, and the memory figures matched to 0.1 MB.
The software was PHP 8.2.31 and Eloquent from illuminate/database 12.69.3, used on its own over a SQLite file. And the Eloquent methods it times are the same ones the Laravel 13 docs describe.
Show data table
| Item | Value |
|---|---|
| get() | 138.2 MB |
| lazy(1000) | 6 MB |
| chunk(1000) | 4.6 MB |
| chunkById(1000) | 4.6 MB |
| cursor() | 3.5 MB |
Every batch method kept memory flat, while get() held the whole table.
And every batch method kept memory flat, because it holds one batch at a time instead of the whole table. Among them, chunkById is the safe default. The Eloquent docs explain why: if the loop updates the column the query filters on, chunk can give "unexpected and inconsistent results". In contrast, chunkById always starts the next batch after the last id it saw.
Still, the cost of batching is more queries and a little more code. And it backfires when the closure collects results into an array, because memory then grows with the table again.
Does the lowest-memory method also finish first?#
No: cursor() held the least memory at 3.5 MB but took 1,197 ms over 100,000 rows, while chunkById(1000) finished in 362 ms. In short, memory and time trade against each other.
Show data table
| Point | Peak memory | Time to read 100,000 rows |
|---|---|---|
| chunkById | 4.6MB | 362ms |
| chunk | 4.6MB | 635ms |
| lazy | 6MB | 641ms |
| cursor | 3.5MB | 1197ms |
The method that holds the least memory takes the longest.
Because cursor runs one query and builds one model at a time as you loop, it keeps memory lowest. But the loop pays for every row one by one. Also, it cannot eager load relationships, per the Eloquent docs, which point to lazy() instead.
On MySQL, cursor has a second catch. And the Eloquent docs say it can still run out of memory because of "PHP's PDO driver internally caching all raw query results in its buffer". Also, the PHP manual confirms that queries use the buffered mode by default. The SQLite run above does not show this, since that driver does not hold the whole result the same way. Therefore, on MySQL, prefer lazyById or chunkById for very large tables, and keep cursor for exports where a slow but steady loop is fine.
What do php artisan optimize and OPcache cache, and how do they break a deploy?#
php artisan optimize caches config, events, routes and views, and after config:cache every env() call outside a config file returns null. The Laravel 13 deployment docs say that once config is cached, "all calls to the env function for .env variables will return null". So move every env() call into a config file, and read the value with config().
In practice, the command is cheap to run and removes file work from every request. But it backfires in two ways. First, a deploy that forgets to rerun it serves the old routes and config. Second, optimize:clear removes the cache files "as well as all keys in the default cache driver", by the same page. So running it in production also empties your app cache.
OPcache keeps compiled PHP in shared memory, so PHP skips parsing on each request. In the PHP manual's defaults, opcache.memory_consumption is 128, counted in megabytes. Also, max_accelerated_files is 10000, and validate_timestamps is on with a revalidate_freq of 2 seconds. So by default PHP checks files for changes every 2 seconds. Some deploys turn validate_timestamps off to skip that check.
And that is where it bites. With timestamps off, the manual says you must reset OPcache "manually via opcache_reset(), opcache_invalidate() or by restarting the Web server". If a deploy skips the reset, it keeps serving the old code. Preloading has the same rule, since the preloading page says clearing preloaded scripts needs a restart of the PHP process.
When do Redis caching, queues and Octane pay off, and how does each backfire?#
Cache what is read often and changes rarely, queue what the response does not need, and adopt Octane last, because its workers keep state between requests. Each of these moves work instead of removing it, so each one needs its own plan for failure.
Caching. Cache::remember stores a value and rebuilds it on a miss. But the weak spot is the request that hits the miss and waits. For that case, the Laravel 13 cache docs offer Cache::flexible, which can "allow partially stale data to be served while the cached value is recalculated". So the cost is stale data for a window you choose.
On Redis, also set a memory limit. The Redis eviction docs say a maxmemory of zero means no limit on 64-bit systems. Under the noeviction policy, a full Redis returns errors on writes. Meanwhile, the volatile policies act like noeviction when no key has an expiry.
Queues. The queues docs suggest moving "time intensive tasks", such as parsing an uploaded CSV file, out of the request. But the cost is a worker to run and failed jobs to handle. For Redis queues, Horizon tracks job throughput, runtime and failures. And the queues at scale post covers retries and failure handling in depth.
Octane. Octane keeps the app booted between requests, so the boot cost is paid once per worker. The Octane docs note that "Octane gracefully restarts any worker once it has handled 500 requests" to contain memory leaks. The backfire is shared state: if a singleton captured the container or the request, it keeps a stale copy on later requests. So audit your service providers before you switch.
| Move | Pays off when | What it costs | How it backfires |
|---|---|---|---|
| Caching | a value is read often and changes rarely | stale data for a window you choose, with Cache::flexible | the request that hits the miss waits; a full Redis under noeviction returns errors on writes |
| Queues | the response does not need the work, such as parsing an uploaded CSV file | a worker to run and failed jobs to handle | failed jobs need handling; Horizon tracks failures for Redis queues |
| Octane | the boot cost matters, since it is paid once per worker | workers restart after 500 requests to contain memory leaks | a singleton that captured the container or the request keeps a stale copy |
Which Laravel 13 docs should you work from, in order?#
Work from five Laravel 13 pages in order: Pulse to find the request, Eloquent relationships and Eloquent to fix queries, deployment for caches, then queues. Keep the database manual open beside the query step.
- Pulse: the slow requests and slow queries cards, and their thresholds.
- Eloquent relationships: with(), eager loading and the lazy loading guard.
- Eloquent: chunkById, lazy and cursor, and when each fits.
- MySQL 8.4 EXPLAIN or PostgreSQL EXPLAIN: reading the plan before you add an index.
- Deployment: php artisan optimize and the env() rule.
- Queues: moving slow work out of the request.
What is the smallest code that stops N+1 queries reaching production?#
Two lines do most of it: Model::preventLazyLoading outside production in AppServiceProvider, and with() on the query the failing page runs. Then a batch loop covers any job that walks a whole table.
// 1. app/Providers/AppServiceProvider.php: throw on lazy loading outside production
use Illuminate\Database\Eloquent\Model;

public function boot(): void
{
    Model::preventLazyLoading(! $this->app->isProduction());
}

// 2. The listing that now throws in development is fixed with one eager load
$books = Book::with('author')->get();

foreach ($books as $book) {
    echo $book->author->name;
}

// 3. A batch job reads the table in id order, one batch at a time
use Illuminate\Database\Eloquent\Collection;

Book::where('archived', false)
    ->chunkById(200, function (Collection $books) {
        $books->each->update(['archived' => true]);
    }, column: 'id');
Once the guard is on, an N+1 loop fails a local page or a test instead of slowing production. And production keeps working if one slips through, since the guard is off there.
When not to tune Laravel code, and what to fix instead?#
If Pulse shows fast requests and the page still feels slow, the time is in the browser, the network or the database server, and Laravel code changes will not move it. Because Pulse times requests inside the app, a fast Pulse and a slow page point somewhere else.
Three cases call for a different tool. First, heavy images, scripts and fonts are a browser problem. So measure them in the browser's own performance tools and fix delivery there. Second, a server far from its users adds time before Laravel runs at all. So a CDN or a closer region solves that. Third, the database server may be too small or badly tuned. When EXPLAIN shows a good plan and the query is still slow, look at the server itself, as the MySQL bottlenecks post does.
For the front-end and delivery half, Atyantik's web performance work starts from the same rule of measuring first. Laravel performance optimization only covers the time your app spends on the server.
Where should you go next?#
Read the MySQL bottlenecks post when EXPLAIN points at the database, and the queues post when the fix is moving work out of the request. And each one takes a step of this loop further.
- Common MySQL performance bottlenecks, for slow queries with a good plan.
- Laravel queues at scale, for retries, Horizon and failed jobs.
- Laravel for SaaS, for how these choices land in a multi-tenant product.
If you would rather have someone profile the app with you, Atyantik can match you with a Laravel software engineer. Still, the loop above needs nothing but the Laravel 13 docs and your database manual, and for most slow pages those two are enough on their own.