Why is my website slow? Slow website or slow hosting, the theme or the code
If you run a business website that feels slow, you are probably about to pay a host, a theme seller or a developer to fix it. Three free readings tell you which of them owns the problem before you spend anything.
Slow website or slow hosting: how do you tell which?#
One slow page load splits into three parts you can read for free: server time points at the hosting, download size at the theme, and browser work at the code. Google's web.dev guide to optimizing LCP, read in November 2026, gives each part an ideal share of a good load. About 40% goes to the server's first byte and about 40% to downloading the main image or text. Then each of the two waits around them should take under 10%, by the same guide.
Show data table
| Segment | Value (% of a good load) | Share |
|---|---|---|
| Server | 40 | 40% |
| Load delay | 10 | 10% |
| Download | 40 | 40% |
| Render delay | 10 | 10% |
Server time and download each get about 40% of a good load, so the two waits around them should stay small.
That split is useful because each slice belongs to someone different. The first slice is the host and the server setup. Next, the download slice is mostly the theme, its images and its fonts. Finally, render delay is the browser running code before it can paint. So the question "slow website or slow hosting" has a measured answer: whichever slice runs furthest past its share.
Google adds a caution in the same 2026 reading of that guide, and it matters. In its words, "these time breakdowns are guidelines, not strict rules". If your loads already finish inside 2.5 seconds, the proportions do not matter. But once a page is slow, they show you where to look.
Is your website slow for real people, or only in one test?#
Google's PageSpeed Insights documentation, read in November 2026, describes two kinds of result: field data from real Chrome users over the last 28 days, and one Lighthouse lab run. Lighthouse is Google's automated test that loads your page once on a simulated phone. Meanwhile, the field data comes from the Chrome UX Report, a public record of what real Chrome visitors experienced.
So trust the 28-day field data at the 75th percentile over one lab score, because the field data is what real people on real phones got. The 75th percentile means three in four visits were at least that fast. The PageSpeed Insights documentation, read in November 2026, notes that "Both data sources represent trailing 28-day periods". So a fix you make today takes weeks to show in full.
The two halves often disagree, and that is normal. Google's web.dev article on lab and field differences explains that a lab test uses fixed device and network settings. Real visitors bring their own. And the LCP guide is blunt about which to believe: if Lighthouse and the Chrome UX Report disagree, the field data "likely provides a more accurate picture". In practice, read the top half of the report first and treat the lab score as a clue, not a verdict.
Most sites still fall short on phones. HTTP Archive is a public crawl of millions of websites. Its 2025 Web Almanac reported that 48% of mobile websites passed all three Core Web Vitals, Google's user-experience measures, up from 32% in 2021.
Show data table
| Dimension | mobile | desktop |
|---|---|---|
| 2021 | 32% | 41% |
| 2022 | 31% | 44% |
| 2023 | 36% | 48% |
| 2024 | 44% | 55% |
| 2025 | 48% | 56% |
Fewer than half of mobile websites passed until 2025, when 48% did.
How much of the wait is the server, and when is the hosting to blame?#
Google's web.dev guidance, read in November 2026, calls a server response of 0.8 seconds or less good and anything over 1.8 seconds poor. That reading is TTFB, and PageSpeed Insights shows it in the field data as an experimental metric. Google's Lighthouse test is stricter in the lab. Its server response audit, read in November 2026, fails when the browser waits more than 600 ms (milliseconds) "for the server to respond to the main document request".
If time to first byte is over the poor line on several pages, the hosting is a suspect. And if a plain file with nothing of the site in it is slow too, the hosting or the server setup is the first call. Many sites sit in that zone. In HTTP Archive's 2025 Web Almanac, 44% of mobile websites had a good TTFB and 17% had a poor one.
Show data table
| Dimension | TTFB | LCP |
|---|---|---|
| Good | 44% | 62% |
| Needs improvement | 40% | 25% |
| Poor | 17% | 13% |
Fewer than half of mobile websites had a good server response in 2025, against 62% with a good LCP.
Then confirm it with the plain-file test. OVHcloud is a large web hosting company, and its hosting guide, read in November 2026, says to "Test the hosting with a file independent from your website". Upload one small file the site's code never touches, such as a tiny text page, and open it. If that file also crawls, the server or the network is slow. But if it opens instantly while your pages wait, the host is serving files fine and is being asked to do slow work by the site.
You can see the same number on your own machine. Chrome DevTools, the inspector built into Chrome, has a Network panel with a timing view. There, the row labelled Waiting (TTFB) is the time the browser sat waiting for the first byte. If you use Cloudflare, a service that sits in front of many sites, its slow-website guide, updated in October 2026, points you to origin response times. That checks your own server separately.
Still, pause before you blame the host. Google's web.dev guide to optimizing TTFB notes that a slow first byte can also come from redirects, missing server caching or slow database queries. Those belong to whoever built the site, even though they show up as server time.
How do you tell if the theme and its images are too heavy?#
HTTP Archive's 2025 crawl, read in November 2026, puts the median mobile home page at 911 KB of images and 632 KB of JavaScript, so compare your page against those first. Here KB means kilobytes, HTML is the page's text and structure, and CSS is its styling. Lighthouse lists your page's total weight under its diagnostics. When the server answers fast but the page still crawls, the bytes the theme ships are the next suspect. Those are mostly images, fonts and the theme's own scripts. So their weight by type shows which.
Show data table
| Item | Value |
|---|---|
| HTML | 22 KB |
| CSS | 77 KB |
| Fonts | 122 KB |
| JavaScript | 632 KB |
| Images | 911 KB |
Images and JavaScript are most of the median mobile home page.
Then place your whole page on the curve. The same HTTP Archive 2025 Page Weight report put the median mobile page at 2,164 KB in total. In that 2025 report, the 75th percentile was 4,119 KB and the 90th was 8,337 KB. A page near the median is normal. But a page past the 90th percentile is heavier than nine in ten pages on the web, and the theme or its images are a likely cause.
Show data table
| Item | Value |
|---|---|
| 10th percentile | 516 KB |
| 25th percentile | 1,127 KB |
| Median | 2,164 KB |
| 75th percentile | 4,119 KB |
| 90th percentile | 8,337 KB |
A page past 8,337 KB is heavier than nine in ten mobile pages.
Images are the usual culprit because a theme often ships large photos scaled down by the browser. Then fonts come next, especially when a theme loads several families and weights. If one type dwarfs the others, that type is the job to hand over. But Google's LCP guide adds one twist. A smaller main image only helps when the browser can paint it promptly. Otherwise the time just moves to the next slice.
How do you tell if scripts and code are the problem?#
A page whose bytes arrive quickly but still shows its main content late, or freezes after a tap, is waiting on code rather than on the server or the download. Long render delay and a poor INP (Interaction to Next Paint) reading point at code and third-party scripts, which run on the phone after everything has downloaded.
INP measures how fast the page reacts when someone taps or types. Google's web.dev INP guide, read in November 2026, calls 200 milliseconds or less good and anything over 500 milliseconds poor. PageSpeed Insights shows INP in the field data, so you can read it for your own site. A poor INP with a good TTFB is a strong sign the host is not the problem.
Third-party scripts are the most common code suspect. These are pieces of code loaded from other companies, such as chat widgets, analytics tags, ad tags and booking tools. Google's web.dev guide to third-party JavaScript puts it plainly. If your own code is fine and the site is still slow, "it's probably the fault of third-party scripts." Almost every site has them. In particular, HTTP Archive's 2025 Web Almanac found that around 90% to 92% of pages use at least one.
Render delay shows up in Chrome DevTools too. Google's LCP guide, read in November 2026, says the Performance panel shows a breakdown of the LCP parts in its insights. If render delay is the big slice, the browser had the image and was still busy running code. That points at the theme's scripts or the plugins and tags added on top, not at the host.
Which part of your own load is over its share?#
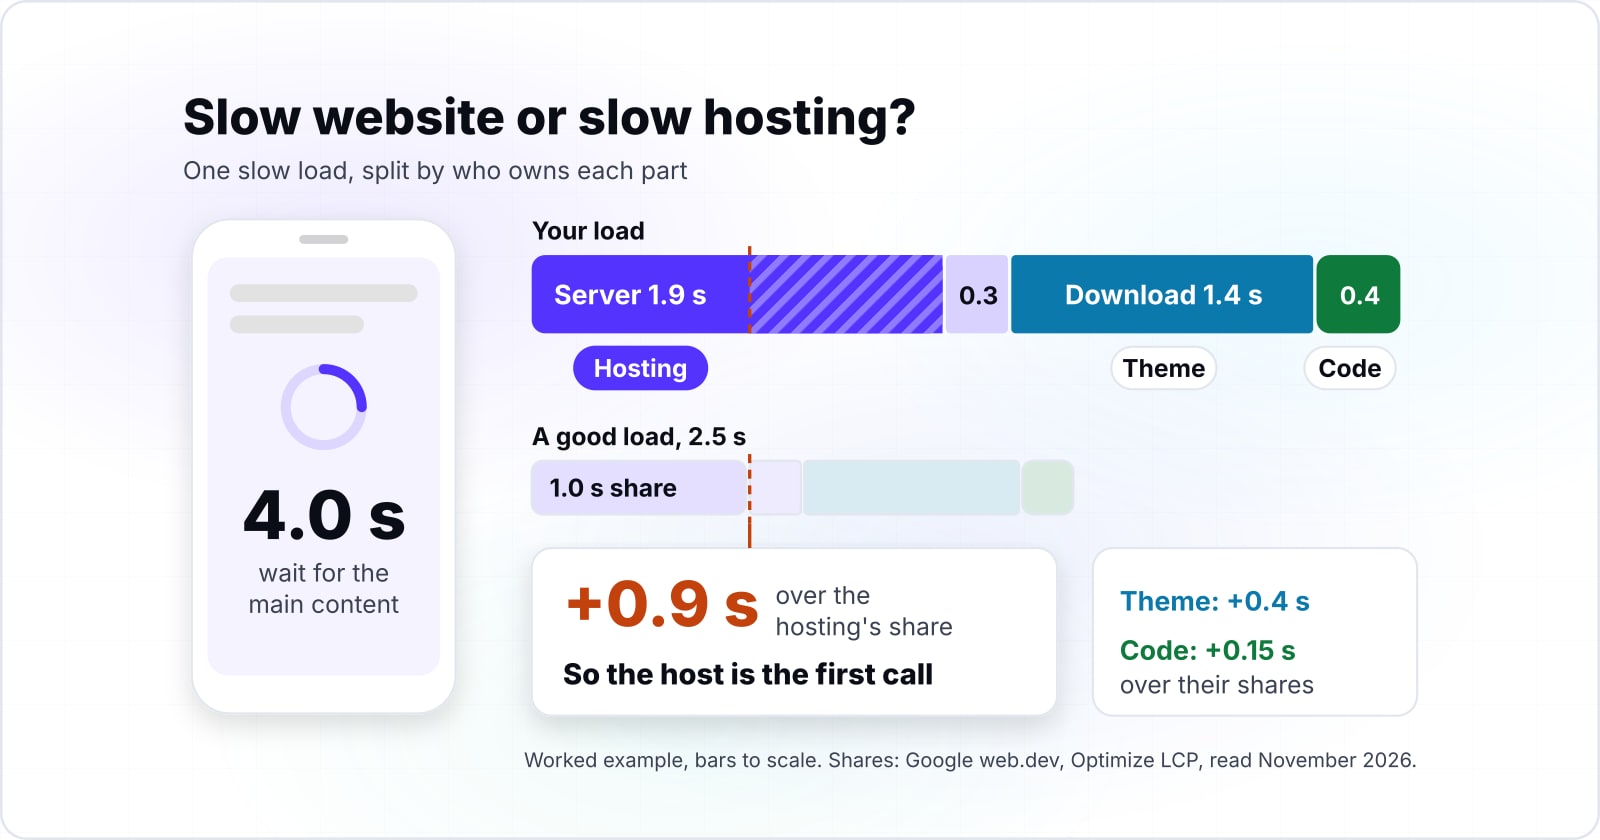
In this worked example a phone waits 4.0 seconds for the main content, and a 1.9 second server response alone is 0.9 seconds over the hosting's share of a 2.5 second load. Split the 2.5 second good line by Google's ideal shares and the part furthest over its seconds is the first one to fix.
The budget is simple arithmetic on Google's numbers, as read in November 2026. Take web.dev's 2.5 second good line for LCP and its ideal shares from the optimizing guide. That gives about 1.0 second for the server and 0.25 seconds for the load delay. Then the download gets 1.0 second and render delay 0.25 seconds.
Which part of your load is furthest over its share
Enter your own readings in seconds from PageSpeed Insights or Chrome DevTools; the defaults are the illustrative example below.
Largest overrun, ms: the first call
900
- Server over its 1.0 s share, ms (the host)
- 900
- Download over its 1.0 s share, ms (the theme)
- 400
- Render delay over its 0.25 s share, ms (the code)
- 150
- Load delay over its 0.25 s share, ms
- 50
Arithmetic from Google web.dev, Optimize LCP and Largest Contentful Paint, read November 2026. Modelled, not measured.
Now the illustrative numbers for this 2026 example. Say the server takes 1.9 seconds and the load delay is 0.3 seconds. Then the download takes 1.4 seconds and render delay is 0.4 seconds. Those add up to the 4.0 seconds the phone waited. Against the budget, the server is 0.9 seconds over and the download is 0.4 over. Render delay is 0.15 over and load delay only 0.05.
So the host is the first call in this 2026 example. Also, the 1.9 second server time is also past web.dev's 1.8 second poor line for TTFB, which settles it. Run the plain-file test before calling, though. If the plain file is fast, the slow server time comes from the site's own code. Then the call goes to the developer instead.
What can you check yourself before paying anyone?#
The first checks cost nothing: read the field data in PageSpeed Insights, test a plain file on the same hosting, and switch off third-party scripts one at a time on a copy. So the cheap checks narrow the cause to one part, and only the fix, not the diagnosis, usually needs paid help.
- Check 1
Read the field data
First, run your busiest page through PageSpeed Insights on mobile. Write down the field LCP, INP and TTFB with the date. That matters because the PageSpeed Insights documentation, read in November 2026, says the data covers the previous 28 days. Then run the same test on two or three other pages. A problem on every page points at the server or the theme. But a problem on one page points at that page's content.
- Check 2
Test a plain file
Second, do the plain-file test from OVHcloud's guide. Then open the same file from your phone on mobile data, so you know whether the slowness follows the network or the server.
- Check 3
Test the scripts
Third, test the scripts. Ask whoever manages the site for a staging copy, a private duplicate where changes do no harm. Then switch off one third-party tool at a time and test again. When one switch moves INP or render delay a lot, you have found your script. Google's third-party JavaScript guide suggests the same idea, checking what each script costs before deciding whether to keep it.
- Check 4
Compare the page weight
Finally, compare your page weight with HTTP Archive's figures from the earlier section. If your images alone are several times the median, compressing them is a fix you can often do yourself.
When is this three-part test the wrong tool?#
The split is the wrong tool when the site is erroring rather than slow, when only one person on one network sees it, or when there is no field data to read. Each of those needs a different check first. That means a status page, a second network, or a lab run repeated several times.
| When | Check first |
|---|---|
| The site is erroring rather than slow | The host's status page and your error logs |
| Only one person on one network sees it | A second network and device |
| There is no field data to read | Run the lab test several times and read the middle result |
If pages fail to load or show error messages, check your host's status page and your error logs first. Speed numbers on a broken page measure nothing useful. And if only you see the slowness, try a second network and device before you change anything. Your own office connection may be the slow part.
The Chrome UX Report also leaves some sites out. Chrome's methodology page, read in November 2026, says a page must be publicly discoverable and "sufficiently popular" to be included. It also lists Chrome on iOS among the excluded browsers, so iPhone visitors in Chrome are not counted. A small or new site may show no field data at all. In that case, run the lab test several times and look at the middle result, because one lab run can swing.
What should you send a host or a developer?#
Send the page address, the field TTFB and LCP readings with their date, the plain-file test result, and which part was furthest over its share. A handover with the readings and the suspect part turns a vague complaint into a job someone can scope and finish.
Five lines are enough, and they look like this.
The page address
First, the page address and whether the problem is on one page or all of them.
The field readings
Second, the field LCP, INP and TTFB from PageSpeed Insights, with the date you read them.
The plain-file result
Third, the plain-file result, fast or slow, on which network.
The part furthest over
Fourth, the part that ran furthest over its share, with the seconds.
What changed recently
Fifth, anything that changed recently, such as a new plugin, tag or host.
Send the server lines to the host and the rest to whoever built the site. A host that sees a fast plain file will point you back to the site. But a developer who sees a slow TTFB on a plain file, say the 1.9 seconds from the example, will point you back to the host. With the readings in hand, neither conversation goes in circles.
Where to go next#
If the readings point at the code or the theme, the guides below go deeper, and website speed optimization services exist for when you want someone to fix it. So pick the route that matches what you found.
- Site optimization in 2026 routes each metric to the fix a developer makes.
- What a website performance audit hands back explains what a paid review delivers once your own checks run out.
- What are Web Vitals? defines LCP, INP and Cumulative Layout Shift in full.
- Reading a Lighthouse report in depth goes past the three readings used here.
When you want the fix done for you, our website speed optimization services start from the same readings. If the site has slowed slowly over months, ongoing maintenance and support keeps someone watching it. Either way, the free readings above are enough to name the slow part on your own.