Why CRM projects fail: what the failure rate measured, and how to fix yours
A CRM that disappoints is rarely beyond repair. It usually lacks a written goal, a mapped process or data people trust, and each of those gaps leaves a trace you can read.
What is the short answer to why CRM projects fail?#
CRM projects fail when the goal, the sales process and the data are left undefined, and the famous failure rate measures missed expectations far more than collapse. The software itself is rarely the cause. In their 2003 MIT Sloan thesis, Luis Bittencourt and Johann Bueno concluded that "Technology plays a secondary role" in these failures. Instead, they pointed to strategic alignment, organizational change and a clear grasp of goals.
So why do CRM projects fail, if the software is rarely to blame? A 2006 paper in Metamorphosis, a SAGE management journal, gives the same answer. Mohammed Al-Ajlan and Mohamed Zairi list organizational change and integration as key issues. They add a third: companies treat the work as a technology project bound by time and budget. In their view, it should be a long-term commitment instead. So the useful question is not which tool to buy next. Rather, ask which of goal, process or data was never settled.
55%
Missed expectations
5%
Failed outright
Only about 5 percent failed outright.
| Option | percent of organizations in Gartner's late-2001 survey of 500-plus organizations |
|---|---|
| Missed expectations | 55% |
| Failed outright | 5% |
Source: Gartner's Ed Thompson to CustomerThink, 18 October 2004
How many CRM implementations fail?#
In Gartner's late-2001 survey of 500-plus organizations, 55 percent of CRM projects failed to meet expectations and about 5 percent failed outright (CustomerThink interview, 18 October 2004). Ed Thompson of Gartner, the research and advisory firm, described the study to Bob Thompson of CustomerThink. The question was simply whether the project met expectations. "I think the figure we originally quoted was 55 percent failed to meet expectations," he said.
Then the press shortened it. In Thompson's account, reporters dropped the words "meet expectations" and printed plain failure. That is where the CRM implementation failure rate in most articles comes from. Gartner also predicted, in late 2001 or early 2002, that the rate would rise to 65 percent. However, Thompson said Gartner never went back and ran the same study to check. Read box by box, the original survey puts most projects in the middle, partly successful. Very few sit at either extreme.
Show data table
| Item | Value |
|---|---|
| Absolute failure | 5 |
| Failed to meet expectations, somewhat unsuccessful | 10 |
| Somewhat successful, failed to meet expectations | 40 |
| Met expectations, somewhat a success | 40 |
| Absolute success | 5 |
Read box by box, the original survey puts most projects in the middle, partly successful.
Why does the CRM failure rate depend on how failure is defined?#
Counting only absolute failure, Gartner's survey gives 5 percent; adding every project that missed expectations raises it to 55 percent, from the same answers. For example, take the three lowest boxes in Gartner's 2001 survey. Count only absolute failure and the rate is 5 percent. Add Gartner's "failed to meet expectations, somewhat unsuccessful" box and it reaches 15 percent. Then add the most common answer in that 2001 survey, "somewhat successful but failed to meet expectations." Now the rate lands on the 55 percent the press reported. It is one reason CRM failure rates quoted online differ so much, since each count may include a different set of boxes.
Show data table
| Step | Change | Running total |
|---|---|---|
| Start | 0 percent | 0 percent |
| Absolute failure | 5 percent | 5 percent |
| Plus unsuccessful | 10 percent | 15 percent |
| Plus missed expectations | 40 percent | 55 percent |
| Reported as failure | 55 percent |
One survey, three failure rates, depending on which boxes count.
That middle box was mostly about payback, Thompson told CustomerThink in 2004. Respondents wrote things like "We aimed to get a payback in 24 months, and we didn't." Yet the same quote goes on to say sales had increased. A late payback is a real problem, but it is not a dead system. Therefore, before you judge your own rollout, write down which outcome counts as failure for you.
5% of surveyed projects counted as failure
1 of 3 boxes counted. 95% of surveyed projects fall outside this count.
Counted: Absolute failure.
Source: Gartner's Ed Thompson to CustomerThink, 18 October 2004
| Outcome box | Share | In your count |
|---|---|---|
| Absolute failure | 5% | Counted |
| Failed to meet expectations, somewhat unsuccessful | 10% | Not counted |
| Somewhat successful but failed to meet expectations | 40% | Not counted |
Where does the 70 percent CRM failure figure come from?#
The 70 per cent failure figure repeated for CRM and other change projects has no valid empirical evidence behind it, according to a 2011 review in the Journal of Change Management. In that 2011 review, Mark Hughes of the University of Brighton traced five published uses of the 70 percent figure. His subject was organizational change in general. In each case, his abstract reports "the absence of valid and reliable empirical evidence" behind the number. Because change is ambiguous and depends on context, he argues, a fixed failure rate is hard to measure at all. Competing views of the result and the timing of the check both move it.
Sales software picked up the same figure. For instance, the 2006 Metamorphosis abstract says "nearly 70% of CRM projects failed worldwide." It credits "many studies" but does not name one. As a result, 70 percent is best read as a story that gets retold, not a count anyone made. So do not plan a rollout around it, and do not panic over it.
- 2001
Gartner's late-2001 survey
In Gartner's late-2001 survey of 500-plus organizations, 55 percent of CRM projects failed to meet expectations and about 5 percent failed outright (CustomerThink interview, 18 October 2004).
- 2004
Gartner never checked again
However, Thompson said Gartner never went back and ran the same study to check.
- 2006
The 70 percent in a journal abstract
For instance, the 2006 Metamorphosis abstract says "nearly 70% of CRM projects failed worldwide." It credits "many studies" but does not name one.
- 2011
No valid evidence behind 70 percent
In that 2011 review, Mark Hughes of the University of Brighton traced five published uses of the 70 percent figure.
What are the common reasons for CRM failure?#
Most CRM failures trace to a handful of causes: no measurable goal, an unmapped process, untrusted data, absent sponsorship, and customisation that outgrew the platform. Studies of why CRM implementations fail keep naming the same few. The 2006 Metamorphosis paper lists organizational change, integration and treating the work as a technology project. Microsoft's Dynamics 365 implementation guide, last updated on 15 September 2025, adds one more. It warns against copying the old system. Each cause leaves its own trace:
- No measurable goal. No one can say whether the system is working, so every opinion about it carries equal weight.
- An unmapped process. The pipeline stages do not match how deals really move, so reps keep a spreadsheet on the side.
- Untrusted data. Duplicates and stale records pile up, so managers stop believing the reports.
- Absent sponsorship. Leaders ask for numbers in meetings but never open the tool, so records get updated the night before a review.
- Customisation that outgrew the platform. Simple changes take weeks and upgrades slip, because custom code has to be checked again each time the vendor ships an update.
Knowing why CRM projects fail helps only once you can see which cause is yours. So why does CRM fail in your company? Start from the symptom, because it points to the cause far more reliably than a general list.
Why do bad data and absent leaders sink a CRM?#
In Validity's 2025 survey of 602 CRM users and administrators, 76 percent said less than half of their CRM data is accurate and complete. Validity sells data-quality software, so these are a vendor's findings and read best that way. Still, the July 2025 release puts numbers on problems most teams know well. In particular, Validity reports that 37 percent of organizations lose revenue as a direct result of poor data quality.
Worse, 37 percent of staff in the same 2025 survey said they regularly fabricate data to tell leaders what they want to hear. Validity's 2025 release also says workers spend, on average, 13 hours a week hunting for basic information in the system. Taken together, untrusted records are the common case in Validity's sample, not the edge case.
Show data table
| Item | Value |
|---|---|
| Say less than half of their CRM data is accurate and complete | 76 |
| Lose revenue as a direct result of data quality | 37 |
| Staff regularly fabricate data to tell leaders what they want to hear | 37 |
Untrusted records are the common case in Validity's sample, not the edge case.
Of these, the made-up records do the most damage. Once a rep enters what a manager wants to see, every report built on that entry is fiction. Then the system loses the one reason it exists, which is to show the business what is really happening.
Do leaders act on what the CRM shows them?#
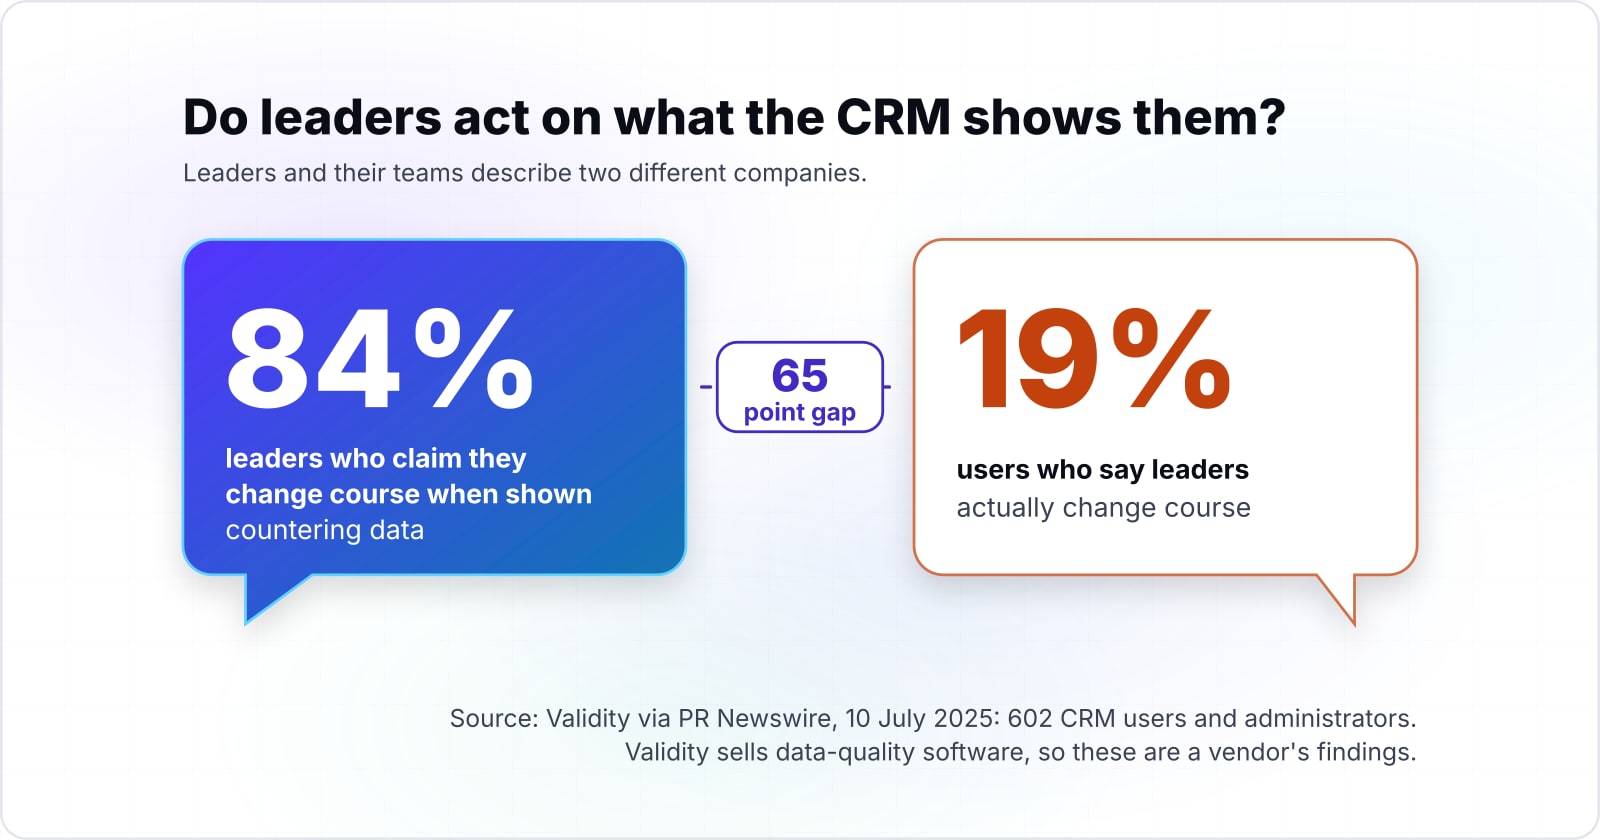
In the same Validity survey, 84 percent of leaders claimed they change course when shown countering data, while 19 percent of CRM users said leaders actually do. That is a 65 point gap in Validity's July 2025 findings. The same release says 68% of executives believe their teams have adequate data.
84%
Leaders who claim they change course when shown countering data
19%
CRM users who say leaders actually change course
Leaders and their teams describe two different companies.
| Option | percent of respondents, Validity survey of 602 CRM users and administrators |
|---|---|
| Leaders who claim they change course when shown countering data | 84% |
| CRM users who say leaders actually change course | 19% |
The gap matters because people stop keeping records that no one acts on. However, sponsorship is not a signed budget or a launch email. Instead, it is a leader who runs the weekly pipeline review from the live screen. That leader also changes a decision because of what it shows. When a team sees that happen, careful data entry starts to look worth the effort.
How do you fix a broken CRM system?#
Fix a broken CRM by naming the one symptom users complain about, tracing it to its cause, and repairing that cause before changing any configuration. First, ask the people who use it every day for the one complaint they repeat most. Then find that complaint in the table below, which turns common CRM failure examples into a cause and a first fix. Finally, repair that cause alone. Write the complaint down in the user's own words, with the date. Then, a month later, ask the same people whether it has gone.
| Symptom users report | Likely cause | First fix |
|---|---|---|
| No one can say whether the system is working | No measurable goal | Write one goal with a number and a date, and report on it monthly |
| Reps keep a spreadsheet on the side | Unmapped process | Map how a deal really moves, then match the pipeline stages to it |
| Managers do not trust the reports | Untrusted data | Pick the few fields that drive decisions, clean those, and make them required |
| Records get updated the night before reviews | Absent sponsorship | Run the weekly review from the live screen and act on what it shows |
| Every change takes weeks and upgrades slip | Over-customization | Compare custom code to the standard app and remove what settings can do |
For the last two rows, Microsoft's Dynamics 365 guide, updated in September 2025, gives a useful first step. It recommends that you review your existing business processes and compare them to what the standard app offers. In short, why CRM fails and how to fix it follow one order: symptom, cause, then fix. The right CRM fix is usually smaller than the project that caused the problem. Adding features to a system no one trusts only adds more places for bad data to hide.
What are the problems with over-customizing CRM systems?#
Over-customising a CRM makes every upgrade a project and every departure a risk, which is why Microsoft's Dynamics 365 guidance favours configuration over custom code. Dynamics 365 is Microsoft's family of customer and business apps. Its implementation guide, last updated on 15 September 2025, says "the platform favors low-code/no-code techniques that rely on configuration rather than custom code." It also notes that custom code brings extra upkeep, best left to professional developers. For example, Microsoft's guide says the platform might let custom code run for up to two minutes when a record is created. That would freeze the screen for the user the whole time.
The same guide names the trap plainly. "A common mistake in an implementation project is to try to replicate the legacy system," it says. According to Microsoft, that habit "leads to excessive customization." It also limits access to future features in the standard service. The guide warns that custom controls take time to build and keep up, and that they need special skills. Sometimes, it says, user training can save hundreds of hours of development and testing.
What CRM implementation challenges do small and mid-sized businesses face?#
A small or mid-sized business meets the same causes with less slack, because one owner usually holds the goal, the process and the budget at once. CRM implementation challenges for SMEs, small and mid-sized enterprises, come from the same list with fewer people to absorb them. In fact, the famous Gartner figure may not describe them at all. In the 2004 CustomerThink interview, Thompson said the 500-plus organizations in the 2001 survey were large Gartner clients. He added that "the smaller projects do much better."
Meanwhile, the risk in a smaller firm is concentration. When one owner holds the goal, the process and the budget, an unwritten goal lives in one head. It fades as soon as that person gets busy. Therefore, start with one team and one process, and write the goal down. Then adopt the standard process the platform ships with. Microsoft's guide makes the same case: standard processes leave a business less dependent on costly, hard-to-maintain customizations.
One team, one process
Therefore, start with one team and one process, and write the goal down.
The standard process
Then adopt the standard process the platform ships with.
When is fixing a failing CRM the wrong fit?#
Repair is the wrong fit when the platform cannot run the process without custom code everywhere, or when nobody will own the goal after the fix. Three cases call for a different route, and each has a better one.
First, if the platform cannot run your core process without custom code in every corner, replace it rather than patch it. Before that, though, check the platform's app marketplace for a partner solution. Microsoft's guide says one can save time and effort in development and testing. If none fits, compare options with real trials, as the guide to choosing a replacement platform sets out.
Second, if no one will own the goal after the repair, pause and rescope to one team that has an owner. Without an owner, a fix tends to slide back as old habits return. Third, if your process is unusual and is the reason customers choose you, a custom build may fit better than bending a vendor's tool around it. Whichever case applies, use your written definition of failure as the stopping rule. If the system still lands in your failure box after one repair cycle, stop repairing and change course.
Where do you go from the diagnosis?#
Once the cause is named, the practices, the selection tests and the performance case each live in their own guide. For the habits that keep a repaired system healthy, read the CRM best practices guide. If the triage says the platform itself is wrong, the guide on how to choose a CRM walks through the trial tests. To set a goal worth measuring, see how a CRM improves business performance.
When the cause is heavy customization that needs untangling, our CRM development page describes that work. When the process truly fits no packaged tool, the custom software development page covers that route. For many teams, though, the triage above and Microsoft's own implementation guide are enough to start the repair alone.
| Where the diagnosis left you | Read next |
|---|---|
| The cause is named and the system needs habits that keep it healthy | CRM best practices |
| The triage says the platform itself is wrong | How to choose a CRM |
| You need a goal worth measuring | How a CRM improves business performance |