How CRM improves business performance, and when it does not
Most CRM statistics promise a lift without saying where it comes from. Trace each number to the part of the system that moves it, and the choice to buy, expand or wait becomes a question you can answer.
Which mechanisms explain how CRM improves business performance?#
A CRM is software that keeps every customer, deal and conversation in one shared record, and it improves business performance through four mechanisms that work only when the team records its work there. The four are one shared customer record, a staged pipeline, follow-up that does not rely on memory, and forecasts built from recorded deals. That single condition explains most of the gap between CRM statistics and real results.
First, the software's own documentation shows the scope. Microsoft's Dynamics 365 Sales overview says the product helps a team "keep track of your accounts and contacts, nurture your sales from lead to order". It also says that the product can forecast "how much revenue your sales team will generate in a given timeframe." So the record, the stages and the forecast are what the tool holds. In other words, a CRM is a place to write down customer work so that other people and reports can use it.
Independent research points the same way. In October 2005, Mithas, Krishnan and Fornell published a study in the Journal of Marketing (Mithas and colleagues, 2005). They found that the use of CRM applications is "positively associated with improved customer knowledge" and with customer satisfaction. But notice what the study measured. It found a link through knowledge, which is exactly what a shared record creates. It did not find that buying the software alone lifts revenue.
In short, each mechanism is a habit the system makes easier. When the team keeps the habit, the number moves. When it does not, the CRM becomes an expensive address book.
Where does a sales team's week go before a CRM changes anything?#
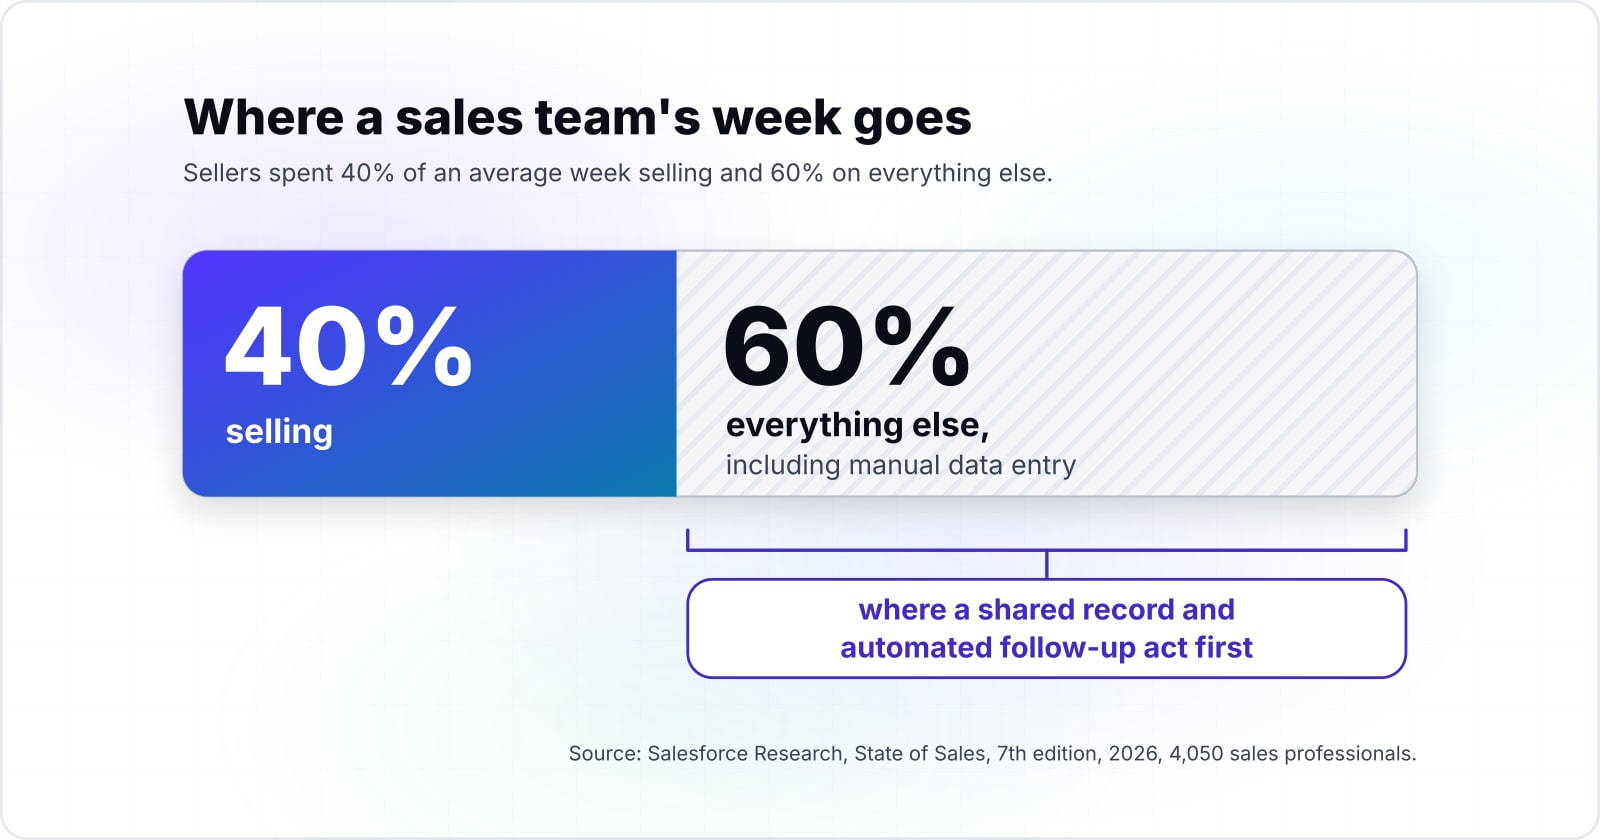
Sellers in the 2026 Salesforce State of Sales survey spent 40% of an average week selling and 60% on everything else, including manual data entry. That non-selling share is where a shared record and automated follow-up act first. After all, it is time the team already spends on work a system can carry.
Salesforce Research surveyed 4,050 sales professionals in 22 countries for the 7th edition of State of Sales, published in 2026. The report says reps "spend more than half of their time on nonselling work like data entry". Since this is a vendor's own survey, treat it as a picture of the problem. It is not proof of any fix.
Show data table
| Segment | Value (percent of the week) | Share |
|---|---|---|
| Selling | 40 | 40% |
| Not selling | 60 | 60% |
Sellers spend more of the week on non-selling work than on selling, and that share is where a CRM acts first.
The chart matters for one reason. If a business wants more selling time, the CRM has to take work away from people. It cannot add a form to fill in after every call. So the first test of any CRM is simple: does it remove typing, or create more of it?
Which business numbers can a CRM move, and how does each one move?#
Each of the four mechanisms moves a different number: the shared record moves retention, the pipeline moves win rate, follow-up moves response time, and the forecast moves planning accuracy. That is how CRM improves business performance in practice, one mechanism for each number. So a business should name the number it cares about before it names a CRM feature.
The shared record. When every call, email and order sits in one place, anyone who talks to the customer knows the history. The 2005 Mithas study found that customer knowledge is the path through which CRM use relates to satisfaction. It also found that gains in knowledge were larger when firms shared customer data with supply chain partners. Because satisfied customers are the ones who stay, this is where retention starts.
The staged pipeline. HubSpot's pipeline guide describes stages as "steps that signal where a record is in a process." Then, once every deal has a stage, a manager can see where deals stall. Then the team can fix that step instead of guessing. That is how a pipeline lifts win rate.
Follow-up that does not rely on memory. A task tied to the record means the next step happens even when the seller forgets it. As a result, the gap between a question and an answer shrinks. Also, fewer leads go cold while nobody is looking.
The forecast. Because each deal carries a stage and an amount, the system can add them up into an expected total. The accuracy of that total is the number this mechanism moves. A later section works it through.
| Mechanism | Number it moves | Record it needs | Profit lever |
|---|---|---|---|
| Shared customer record | Retention | Every call, email and order logged | Retention |
| Staged pipeline | Win rate | Every deal at its stage | Sales performance |
| Follow-up tasks | Response time | Tasks with dates on the record | Seller time |
| Forecast | Planning accuracy | Amounts and honest stages | Profit efficiency |
A second study adds weight. In 2006, Mithas, Almirall and Krishnan published a paper in Statistical Science that tried to estimate cause, not just correlation (Mithas, Almirall and Krishnan, 2006). They found that "firms using CRM systems have greater levels of one-to-one marketing effectiveness". In practice, the record lets a firm treat each customer as a known person.
How can a good CRM system increase profits?#
A good CRM system increases profits mainly through retention: in a 2004 study of five firms, a 1% retention gain raised customer value by 2.45% to 6.75%, against about 1% for margin. Each of the four mechanisms reaches profit through one lever, and the shared record pulls the largest one.
Gupta, Lehmann and Stuart published that study in the Journal of Marketing Research in February 2004 (Gupta, Lehmann and Stuart, 2004). Then they valued customers using publicly available data for five firms and found that improving "retention by 1% is likely to improve customer and firm value by 3-7%". By contrast, in the same 2004 table, a 1% cut in acquisition cost added only 0.02% to 0.32%.
Show data table
| Dimension | Retention | Margin | Acquisition cost |
|---|---|---|---|
| Amazon | 2.45% | 1.07% | 0.07% |
| Ameritrade | 6.75% | 1.03% | 0.03% |
| Capital One | 5.12% | 1.32% | 0.32% |
| Ebay | 3.42% | 1.08% | 0.08% |
| E*Trade | 6.67% | 1.02% | 0.02% |
At every one of the five firms, a 1% gain in retention added more customer value than the same gain in margin or acquisition cost.
Retention, through the shared record. In practice, customers stay when the people who serve them know their history. The 2005 Mithas study tied that knowledge to satisfaction, and satisfied customers are the ones who stay, so retention is the first profit lever to check.
Sales performance, through the pipeline. A PLOS One study published on 28 April 2021 drew 416 responses from pharmaceutical firms (Shahbaz and colleagues, 2021). In that 2021 study, CRM capabilities had a significant positive link to sales performance, with a beta of 0.306. However, it is a survey link, not a measured change in win rate. So treat any quoted win-rate or sales-cycle figure with care unless it names its study.
Seller time, through follow-up. Sellers in the 2026 Salesforce State of Sales survey spent 60% of their week away from selling. So follow-up that runs from the record aims at that time. The survey measured the problem, though, not the fix.
Profit efficiency, through the forecast and the commitment behind it. Krasnikov, Jayachandran and Kumar studied US commercial banks in the Journal of Marketing in November 2009 (Krasnikov, Jayachandran and Kumar, 2009). Overall, they found CRM implementation "associated with a decline in cost efficiency but an increase in profit efficiency". However, in the same 2009 study, CRM commitment reduced that cost penalty. In short, a CRM adds cost to serve, and profit rises only when the team keeps the records it plans with.
What has independent research actually measured about CRM and performance?#
A study of more than 300 large US firms found CRM use tied to better customer knowledge and satisfaction, a narrower result than most CRM statistics suggest. Peer-reviewed work links CRM use to knowledge, satisfaction and marketing effectiveness. It does not show a universal revenue lift.
The 2005 Journal of Marketing study used InformationWeek survey data on more than 300 large US firms from 2001 and 2002. Then it paired that data with scores from the American Customer Satisfaction Index. So its result is about large firms, and about satisfaction rather than sales.
The 2006 Statistical Science paper went one step further on method. Because trials across real firms are rare, the authors used a propensity score method. It compares firms that use CRM with similar firms that do not. Even so, the outcome they measured was marketing effectiveness, not profit.
A 2009 INSEAD working paper by Coltman, Devinney and Midgley widened the frame (Coltman, Devinney and Midgley, 2009). It treated CRM as a capability built from IT plus the skills of the people using it. It found "a positive and significant path between a superior CRM capability and firm performance". The key word is capability, because the software alone was never what they measured.
Most recently, Springer published a study in the International Entrepreneurship and Management Journal on 11 June 2026 (Springer, 2026). It looked at firms in the Spanish construction sector. It found a strong link between CRM use and a firm's capacity to innovate, and tied both to better expected performance.
- 2005
Journal of Marketing
More than 300 large US firms. CRM use linked to customer knowledge and satisfaction, not to revenue.
- 2006
Statistical Science
A propensity score method. Greater one-to-one marketing effectiveness, not profit.
- 2009
INSEAD working paper
CRM as a capability built from IT plus the skills of the people using it. A positive path to firm performance.
- 2026
International Entrepreneurship and Management Journal
Firms in the Spanish construction sector. CRM use linked to a firm's capacity to innovate.
Retention's value also differs by firm. In the 2004 Journal of Marketing Research table, a 1% retention gain was worth 2.45% of customer value at Amazon and 6.75% at Ameritrade. So the payoff from keeping customers depends on the business, before any software is chosen.
Show data table
| Item | Increase in customer value for a 1% retention gain |
|---|---|
| Amazon | 2.45% |
| Ebay | 3.42% |
| Capital One | 5.12% |
| E*Trade | 6.67% |
| Ameritrade | 6.75% |
A 1% retention gain was worth 2.45% of customer value at Amazon and 6.75% at Ameritrade, so the payoff depends on the business.
Taken together, the careful studies agree on direction. However, none of them promises a fixed percentage for a firm that installs CRM and changes nothing else.
Where does the $8.71 return per dollar on CRM come from?#
The $8.71 figure comes from a 2014 Nucleus Research analysis of its own CRM case studies, which found returns rose from $5.60 to $8.71 since 2011. So the most quoted CRM return figure is an analyst estimate from case studies. It describes firms that succeeded, not what a typical business should expect.
In particular, the note itself is short. Nucleus Research wrote on June 21, 2014 that average returns in its CRM case studies rose "from $5.60 to $8.71" for every dollar spent. It gives no count of firms that tried CRM and failed. After all, case studies are written about projects that worked.
$5.60
Average return in Nucleus ROI case studies, 2011
$8.71
Average return in Nucleus ROI case studies, 2014
The figure describes projects worth writing up, so read it as a sign CRM can pay, never a forecast.
Show data table
| Option | dollars returned per dollar |
|---|---|
| Average return in Nucleus ROI case studies, 2011 | $5.60 |
| Average return in Nucleus ROI case studies, 2014 | $8.71 |
Source: Nucleus Research, June 21, 2014
That does not make the number false. Instead, it makes it old and conditional. The tools and habits of 2014 are not today's. Also, the firms in the sample were the ones whose projects were worth writing up. So use the figure as a sign that CRM can pay, never as a forecast of what it will pay you.
How does a CRM turn recorded deals into a revenue forecast?#
HubSpot CRM multiplies each deal's amount by its stage probability, so a deal of 100 at a 0.2 stage adds 20 to the forecast and 80 at a 0.8 stage. A CRM forecast is simple arithmetic over recorded deals. Its accuracy therefore depends on whether every deal sits at its true stage.
HubSpot's sales analytics guide describes the weighted forecast in plain terms. It "takes the value in the Amount property and multiplies it by the probability" of the deal's stage. Meanwhile, the probability comes from the stage itself. In HubSpot's pipelines API guide, each deal stage needs "a value between 0.0 and 1.0". Its example pipeline sets In Progress at 0.2, Contract signed at 0.8 and Closed Won at 1.0.
Show data table
| Item | Value |
|---|---|
| In Progress | 20 forecast per 100 of deal amount |
| Contract signed | 80 forecast per 100 of deal amount |
| Closed Won | 100 forecast per 100 of deal amount |
A deal adds only its stage's share of its amount to the forecast, so the stage decides the number.
Now take an illustrative pipeline of three deals. Say one deal of $10,000 sits at In Progress, so it adds $2,000 in this example. Say a second deal of $10,000 sits at Contract signed, so it adds $8,000 in this illustrative case. Then a third deal of $5,000 is Closed Won and adds all $5,000 in the example. So the forecast is $15,000, against $25,000 of total deal value in this illustration.
Next, suppose the Contract signed deal has quietly stalled and belongs back at In Progress. In this illustrative case, the true forecast is $9,000, not $15,000. The software did nothing wrong. Instead, the stage was wrong, so the forecast overstated the quarter by $6,000 in this example.
Your forecast, and one stale stage
Enter three deal amounts and each deal's stage probability; it multiplies each amount by its probability and shows the drop when deal two falls back to In Progress.
Weighted forecast
$15,000
- Total deal value
- $25,000
- Forecast with deal two back at In Progress
- $9,000
- Overstatement from deal two's stage
- $6,000
An illustrative pipeline, modelled not measured; the result is only as true as each deal's stage.
This is the forecast mechanism in full. It turns a habit, moving each deal to its true stage, into a number a manager can plan with. When the habit slips, the number looks just as precise and is simply wrong.
Why do some businesses see no gain from a CRM?#
In a 2025 Salesforce survey, 38% of data and analytics leaders said siloed data severely cut revenue opportunities, a problem no CRM feature fixes on its own. The mechanisms stall when records are incomplete, data sits in other tools, or the team does not use the system. So the conditions matter more than the product.
That figure comes from Salesforce's State of Data and Analytics, 2025, reprinted in the 2026 State of Sales report. Also, its respondents are data and analytics leaders, not sellers. They also estimate that 19% of their company's data is siloed or unusable, according to Salesforce's data and analytics trends for 2026.
Show data table
| Item | Value |
|---|---|
| Reduced AI capabilities | 40 percent of data and analytics leaders |
| Lost revenue opportunities | 38 percent of data and analytics leaders |
| Hindered decision-making | 37 percent of data and analytics leaders |
| Lack of unified customer view | 36 percent of data and analytics leaders |
| Reduced personalization | 33 percent of data and analytics leaders |
Lost revenue opportunities rank second among the severe impacts data leaders report from siloed data.
Commitment matters as much as data. For example, the 2009 Journal of Marketing bank study found that CRM commitment reduced the cost penalty of implementation. Similarly, the 2009 INSEAD paper tied performance to capability rather than to software.
Scattered tools make it worse. The 2026 State of Sales report found that teams outside an all-in-one platform use "an average of eight per team". It also found that 42% of reps feel overwhelmed by too many tools. When the customer's history lives in eight places, the shared record is shared by nobody.
Then there is the forecast example above. In that illustrative pipeline, a single stale stage moved the forecast by $6,000. Multiply that by every deal nobody updates, and the forecast turns into a confident wrong number. For a deeper look at these failure conditions, read why CRM projects fail and our CRM best practices guide.
How can you test which CRM mechanism will pay in your business?#
Run three tests before you buy or expand a CRM: name the number, trace it to one mechanism, and check that the records that mechanism needs exist today. That way, you can judge how CRM improves business performance in your own case before you spend anything.
First, name the number. Pick one number that matters this year, such as repeat purchase rate, win rate, time to first reply or forecast error. Without one, no CRM feature will help, because nothing tells you whether it worked.
Second, trace it to one mechanism. Use the map above. Retention points to the shared record, and win rate to the pipeline. Reply time points to follow-up, and forecast error to the forecast. When the number traces to none of the four, a CRM is not the tool for it.
Third, check the records. Each mechanism needs its own records. The shared record needs every contact logged, and the pipeline needs every deal staged. Follow-up needs tasks with dates. And the forecast needs amounts and honest stages. So look at how your team works this week. Then ask whether those records already exist somewhere, even in a spreadsheet.
Finally, add a time check. Sellers already spend most of their week away from selling, as the Salesforce survey found. So any new CRM has to remove typing rather than add it. When the records exist and the tool cuts the work, the mechanism will probably pay. But when the records do not exist, fix the habit first, because the software will only store the gap.
Name the number.
Pick one number that matters this year, such as repeat purchase rate, win rate, time to first reply or forecast error.
Trace it to one mechanism.
When the number traces to none of the four, a CRM is not the tool for it.
Check the records.
Ask whether the records that mechanism needs already exist somewhere, even in a spreadsheet.
Add a time check.
Any new CRM has to remove typing rather than add it.
When is a CRM the wrong tool for a performance problem?#
A CRM is the wrong fix when the problem is the offer, the price or demand, or when a team can still track every deal in a shared spreadsheet. When the performance problem sits outside the customer process, a CRM adds cost without moving the number. For instance, the 2009 Journal of Marketing bank study found CRM implementation tied to a decline in cost efficiency, so a CRM that moves no number is only cost.
When the offer does not fit. Customers may say no because the product does not suit them or costs too much. In that case, a better record of their refusal will not change it. Instead, talk to lost customers and test the offer. Customer interviews and small offer tests are the better tool here.
When demand is the problem. If too few people ever ask, a pipeline has nothing to stage. So marketing, content and partnerships should fill the top first. A CRM only moves numbers that pass through recorded customer work, as the Mithas findings on customer knowledge suggest.
When the deal count is small. A small team with a few dozen live deals can run on a shared spreadsheet with clear columns. So start there and keep the habit. Then move to a CRM once the sheet can no longer show who owns what.
In each case, the honest answer is to fix the real constraint first. A CRM will still be there when the customer work is ready for it.
| The problem | Why a CRM will not move it | Use instead |
|---|---|---|
| The offer does not fit | A better record of a refusal does not change it | Customer interviews and small offer tests |
| Demand is the problem | A pipeline has nothing to stage | Marketing, content and partnerships |
| A few dozen live deals | The sheet still shows who owns what | A shared spreadsheet with clear columns |
What should you read next about CRM?#
If you already run a CRM that is not paying back, start with the 4 conditions in our CRM best practices guide; if you are choosing one, read the selection guide. The next step depends on where the business stands. It may be choosing a CRM, running one that is not paying back, or needing one built around its own process.
For a live system that disappoints, CRM best practices for a system you already own helps you find which condition broke. For the wider pattern, why CRM projects fail covers the common causes. If you are still choosing, how to choose a CRM walks through the selection. And when the mechanism you need does not fit a packaged product, custom software versus off the shelf sets out the trade.
Some businesses need a CRM shaped around their own process, which is what our CRM development work covers. Others have customer data split across tools, and API integrations connect it into one record. Either way, the studies and the documentation linked above are enough to run the three tests on your own and see how CRM improves business performance for you.