Risk-based testing: software testing techniques that put the hours where failure costs most
Every release has more to check than the hours allow. The fix is not more testing but a rule for where the hours go, and that rule fits on one line of arithmetic.
What is risk-based testing, and why not test everything equally?#
Risk-based testing is the software testing technique that selects, prioritises and manages test activities by risk analysis, so effort follows likelihood times impact rather than an even split.
The ISTQB Foundation Level syllabus, version 4.0.1 of 15 September 2024, defines it as testing "in which test activities are selected, prioritized, and managed based on risk analysis". It also gives the formula. In the ISTQB CTFL v4.0.1 syllabus, "the risk level is calculated as the multiplication of risk likelihood and risk impact".
- L
- is how probable a failure is in an area.
- I
- is how much it hurts when it happens.
That line is the whole method, and it is simpler than most software testing techniques it sits beside. Likelihood asks how probable a failure is in an area, while impact asks how much it hurts when it happens. Multiply the two and you get one number per area. A team can rank, compare and argue about it in a single planning meeting.
Testing everything equally sounds fair, but it is a decision too. In practice it means the payment flow gets the same attention as the settings page. Because hours are finite, an even split always takes time from the area where a defect costs most. Risk-based testing makes that trade visible instead of leaving it to habit.
What does an even test split cost a release?#
In this worked example, a release with 100 test hours (assumption) split evenly gives checkout 20 hours, while its risk score earns it about 39.
Take five areas of a web shop, each scored 1 to 5 for likelihood and impact (assumption). Checkout scores 5 by 5, which is 25, and login scores 4 by 5, which is 20. Search is 3 by 3, or 9, while reporting is 2 by 3, or 6, and settings is 2 by 2, or 4. Together the five scores add up to 64.
Under an even split, each area gets 20 of the 100 hours. Under a risk split, checkout gets 25/64 of the hours, about 39. As a result, the riskiest area gets roughly half the hours its score earns when the split is even.
Meanwhile settings, at 4 points, gets 20 hours under the even split and about 6 under the risk split. Those 14 hours are not wasted on settings, but they buy far less there than they would in checkout. So the business case is simple to state upward. The same team, in the same week, puts most of its attention on the failures that would cost the most.
20 h
Even split
about 39 h
Risk split
An even split gives checkout roughly half the hours its risk score earns.
| Option | test hours for checkout, of 100 (assumption) |
|---|---|
| Even split | 20 h |
| Risk split | about 39 h |
Source: worked example (assumption); formula from ISTQB CTFL v4.0.1, 2024
How do you score product risk and project risk?#
Score each area from 1 to 5 for likelihood and for impact (assumption: a five-point scale), then multiply the two to get a risk level between 1 and 25.
The ISTQB CTFL v4.0.1 syllabus (2024) separates two kinds of risk. Project risks "are related to the management and control of the project", such as delays, staff shortages or a supplier that fails to deliver. Product risks "are related to the product quality characteristics", such as wrong calculations, slow response or security holes.
Product risk drives what you test, while project risk drives how the plan itself can slip. For example, a late build is a project risk, so you plan buffer time for it in the schedule. A wrong tax total is a product risk, so you plan tests for it.
To score likelihood, use evidence rather than mood, because a score with no evidence behind it gets changed by whoever argues loudest. Defect history from bug triage is the best input you have. Then add how much the code changed this release, how complex it is and how new the team is to it.
To score impact, ask who is hurt and how badly. Lost revenue, lost trust, a support queue or a legal problem all count. Also keep the scale short. A five-point scale is easy to agree on in one meeting. In particular, the shared conversation matters more than the precision of any single score.
| Area | Likelihood | Impact | Risk level |
|---|---|---|---|
| Checkout | 5 | 5 | 25 |
| Login | 4 | 5 | 20 |
| Search | 3 | 3 | 9 |
| Reporting | 2 | 3 | 6 |
| Settings | 2 | 2 | 4 |
How do software testing techniques split a fixed test budget by risk?#
Give each area a share of the hours in proportion to its risk score, then choose how deep the technique goes inside each share.
The worked example gives the full split. Of the 100 hours (assumption), checkout gets about 39, login about 31, search about 14, reporting about 9 and settings about 6. Those numbers come straight from each score divided by 64.
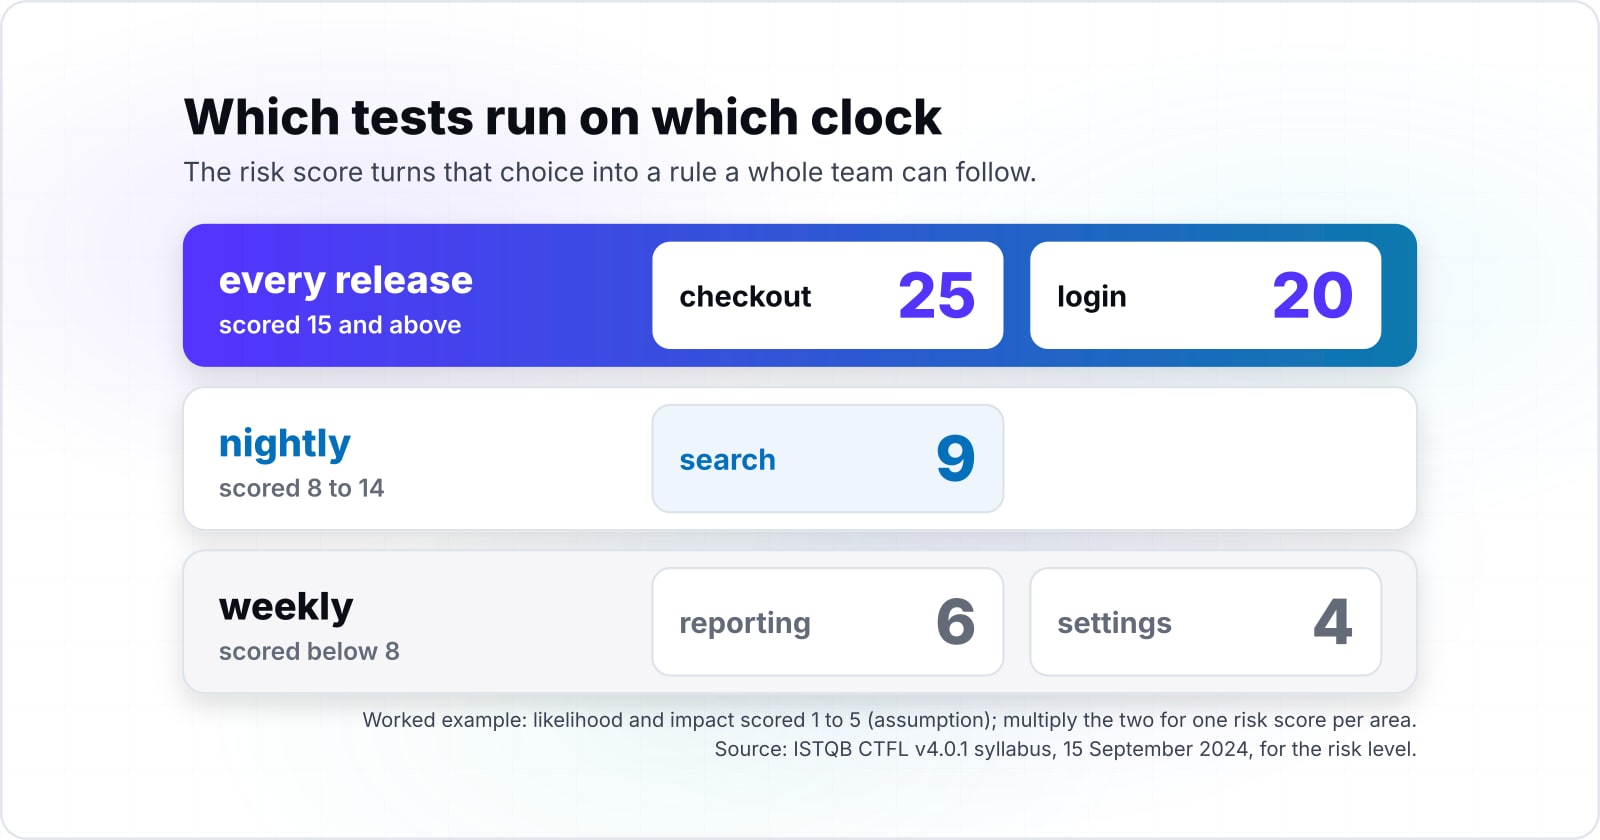
Then the score's tier picks the technique depth. Top-tier areas, scored 15 and above, get boundary value analysis, decision tables, exploratory sessions and negative tests. Middle-tier areas, scored 8 to 14, get the main paths and the known edge cases. Bottom-tier areas, scored below 8, get a smoke check and little else.
This is where software testing techniques and risk meet, and the order matters. The technique is not chosen first and then given a budget. Instead the budget is set by risk, and the technique fills whatever share the score earned. Since exploratory work finds what scripts miss, the top tier is where manual testing improves automation the most.
Your test hours, split by risk
Put in the hours your release has and score each area 1 to 5 for likelihood and impact. The defaults are the worked example (assumption).
Checkout hours under a risk split
39 h
- Any area under an even split
- 20 h
- Login under a risk split
- 31 h
- Search under a risk split
- 14 h
- Reporting plus settings, risk split
- 16 h
Arithmetic from the ISTQB CTFL v4.0.1 risk level formula. Modelled, not measured.
How does risk-based testing differ from requirements-based testing?#
Requirements-based testing asks whether every stated requirement has a test, while risk-based testing asks where a failure would cost most, and most teams need both.
Requirements-based testing works from the test basis. The ISTQB CTFL v4.0.1 syllabus (2024) describes test analysis as "analyzing the test basis to identify testable features", with traceability from the basis to the tests. Its strength is coverage you can prove. Its weakness is that every requirement looks equally important on paper.
Risk-based testing works from the cost of failure, so its strength is focus on the areas that matter most. However, its weakness is that a low-scored requirement can end up with no test at all. An auditor will usually notice that gap before a customer does.
So blend them in a fixed order. First, use requirements to set the floor: every requirement gets at least one test. Then use risk to set the depth: the high-scored requirements get many tests and several techniques. In short, requirements answer "is it covered" and risk answers "how hard do we look".
ISO/IEC/IEEE 29119-2:2021, the test processes part of the international testing standard, published in October 2021, frames test planning as a process a team can audit. Both approaches fit inside it.
| Aspect | Requirements-based testing | Risk-based testing |
|---|---|---|
| Question it asks | Does every stated requirement have a test? | Where would a failure cost most? |
| Works from | The test basis, traced to the tests | The cost of failure |
| Strength | Coverage you can prove | Focus on the areas that matter most |
| Weakness | Every requirement looks equally important on paper | A low-scored requirement can end up with no test |
| Role in a blend | Sets the floor: every requirement gets at least one test | Sets the depth: high-scored requirements get many tests |
How does QA keep up with fast release cycles?#
A fast release runs the tests for whatever its change touches plus every top-tier area, and leaves the lower tiers to a nightly or weekly cycle.
Fast QA does not mean testing less carefully; it means choosing which tests run on which clock. In practice, the risk score turns that choice into a rule a whole team can follow. For every release, run the tests for the changed areas and every area scored 15 or above. Then run the middle tier nightly and the bottom tier weekly.
Google Research faced the same problem at much larger scale. Its 2019 paper on test selection at Google says that testing every commit with all impacted tests "results in delayed test results and high operational costs". It also says the test selection problem "remains largely open". So for most teams a simple, explicit rule beats a clever one that only its author can explain.
Suite size matters for another reason. Google's Testing Blog, in May 2016, measured about 1.5% of all test runs in Google's own corpus as flaky. At that 2016 Google figure, a 1,000-test run would carry about 15 false failures, and the count grows with the suite.
Show data table
| Item | Value |
|---|---|
| 200 tests | 3 |
| 500 tests | 7.5 |
| 1000 tests | 15 |
| 2000 tests | 30 |
False failures per full run grow in step with the suite, so a smaller release run carries less noise.
How do you keep a regression suite small enough to avoid burnout?#
Google's Testing Blog counted 14% of Google's own large tests as flaky in April 2017, against 0.5% of its small tests, so smaller checks mean less triage.
The ISTQB CTFL v4.0.1 syllabus (2024) warns that "the number of regression test cases will increase with each iteration or release". Teams rarely plan a bloated suite. Instead it grows one fix at a time, until the team spends its mornings rerunning red builds.
Burnout comes from noise more than from volume. In the same Google post from 2016, the authors write: "It is human nature to ignore alarms when there is a history of false signals". Once a team stops trusting red, real failures slip through.
So prune by risk. First, bottom-tier areas keep only smoke checks. Second, any large test that guards a top-tier area gets a smaller twin at the unit or service level where possible. Then the large test can move to the nightly run. Finally, delete any test that has not failed for a real reason in a long time and guards a low-scored area.
Also write new regression tests well from the start; clear and effective test cases are cheaper to keep.
Show data table
| Item | Value |
|---|---|
| small tests | 0.5 |
| medium tests | 1.6 |
| large tests | 14 |
Large tests were flaky far more often than small ones, so moving a check down a level cuts the noise a regression run makes.
What does change failure rate tell you about the split?#
DORA's 2025 survey counts 26% of respondents with a change failure rate between 8% and 16%, the most common answer, which gives a team a yardstick for its own releases.
The DORA metrics guide, updated 5 January 2026, defines change fail rate as "The ratio of deployments that require immediate intervention following a deployment". That is the outcome a test allocation exists to move.
- failed
- is the deployments that needed a rollback or a hotfix.
- all
- is every deployment in a month or a quarter.
You can use it in two ways. First, compare the rate before and after the hours move. If it falls, the split is working. Second, look at where the failures land. If they cluster in an area you scored low, its score was wrong, so raise it and move hours there.
Keep the comparison honest, because one release is noise, so look at a month or a quarter of deployments. Also count only failures that needed a rollback or a hotfix, which is what the definition says.
Show data table
| Item | Value |
|---|---|
| 0% to 2% | 8.5 |
| 2% to 4% | 8.1 |
| 4% to 8% | 19.6 |
| 8% to 16% | 26 |
| 16% to 32% | 19.5 |
| 32% to 64% | 12.5 |
| over 64% | 5.9 |
The most common change failure rate in DORA's 2025 survey was 8% to 16%, the range 26% of respondents chose.
Which pages should you build a risk-based test plan from?#
Build the plan from the ISTQB CTFL syllabus for the risk model, then from the DORA metrics guide for the measure that tells you whether it worked.
Open them in this order:
- ISTQB CTFL v4.0.1 syllabus, section 5.2: risk likelihood, risk impact, risk level, and the split between product and project risk.
- ISTQB CTFL v4.0 certification page: the scope of the syllabus, including its learning objective to understand the impact of risk on testing.
- DORA metrics guide: the change fail rate definition and how to measure it across deployments.
Start with the syllabus, because it gives you the model. Next, the certification page shows where that model sits in a shared vocabulary your team may already hold. Finally, the metrics guide gives you the check.
What is the smallest script that turns risk scores into test hours?#
A short Python function multiplies likelihood by impact for each area and divides the release's test hours in proportion to the scores.
It takes three steps. First, score each area as likelihood times impact, as the ISTQB syllabus defines risk level. Then sum the scores. Finally, give each area the hours times its score over the total.
def allocate(hours, areas):
    # Step 1: risk level = likelihood x impact (ISTQB CTFL v4.0.1, section 5.2)
    scores = {name: like * impact for name, (like, impact) in areas.items()}
    # Step 2: the total of all scores
    total = sum(scores.values())
    # Step 3: each area's share of the hours
    return {name: round(hours * s / total, 1) for name, s in scores.items()}

areas = {
    "checkout": (5, 5),
    "login": (4, 5),
    "search": (3, 3),
    "reporting": (2, 3),
    "settings": (2, 2),
}
print(allocate(100, areas))
With the worked example's inputs (assumption), it prints checkout 39.1, login 31.2, search 14.1, reporting 9.4 and settings 6.2. Because it needs no library, it runs on any Python 3 install. Then replace the five areas with your own and rerun it before each release planning meeting.
When is risk-based testing the wrong tool?#
Risk-based testing is the wrong tool to lead with when a regulator or contract demands proof that every requirement was tested, so trace requirements first and rank by risk second.
There are three cases where it should not lead.
First, regulated or contracted coverage, where the duty is proof rather than focus. If an auditor needs a test against every requirement, lead with requirements-based testing and a traceability matrix. Then use risk only to decide depth.
Second, a brand new product with no defect history, where likelihood scores are only guesses. Instead, run time-boxed exploratory testing sessions for a few releases, record what breaks, and score from that.
Third, a tiny change on a tiny product. If the full suite runs in minutes and no release waits on it, scoring costs more time than it saves. In that case, just run everything every time.
| Case | Why risk should not lead | Lead with instead |
|---|---|---|
| Regulated or contracted coverage | The duty is proof rather than focus | Requirements-based testing and a traceability matrix |
| A brand new product | No defect history, so likelihood scores are guesses | Time-boxed exploratory sessions, then score |
| A tiny change on a tiny product | Scoring costs more time than it saves | Run everything every time |
Where should a QA team go next?#
The tests each tier needs are covered in the guide to writing clear and effective test cases. Then, for the exploratory share of the top tier, read how manual testing sharpens automation. Also, to send defect history back into the likelihood score, read about bug triage discussions.
If you need to hire regression testers or QA specialists to run the plan, see how we work with QA teams. If you want test selection wired into the release pipeline, see our DevOps and CI/CD work.
Either way, the ISTQB syllabus and the DORA guide are enough on their own to start.