RFID tag uses and ROI: match the tag to the goods, then check each item's margin
A tag that pays back on a jacket can lose money on a pack of gum. So the goods decide which tag to use, and each item's own margin decides whether it gets one at all.
RFID tag uses and ROI: what is the short answer?#
Choose the tag family the goods need, then tag an item only when its unit margin times the expected sales lift covers the cost of the tag.
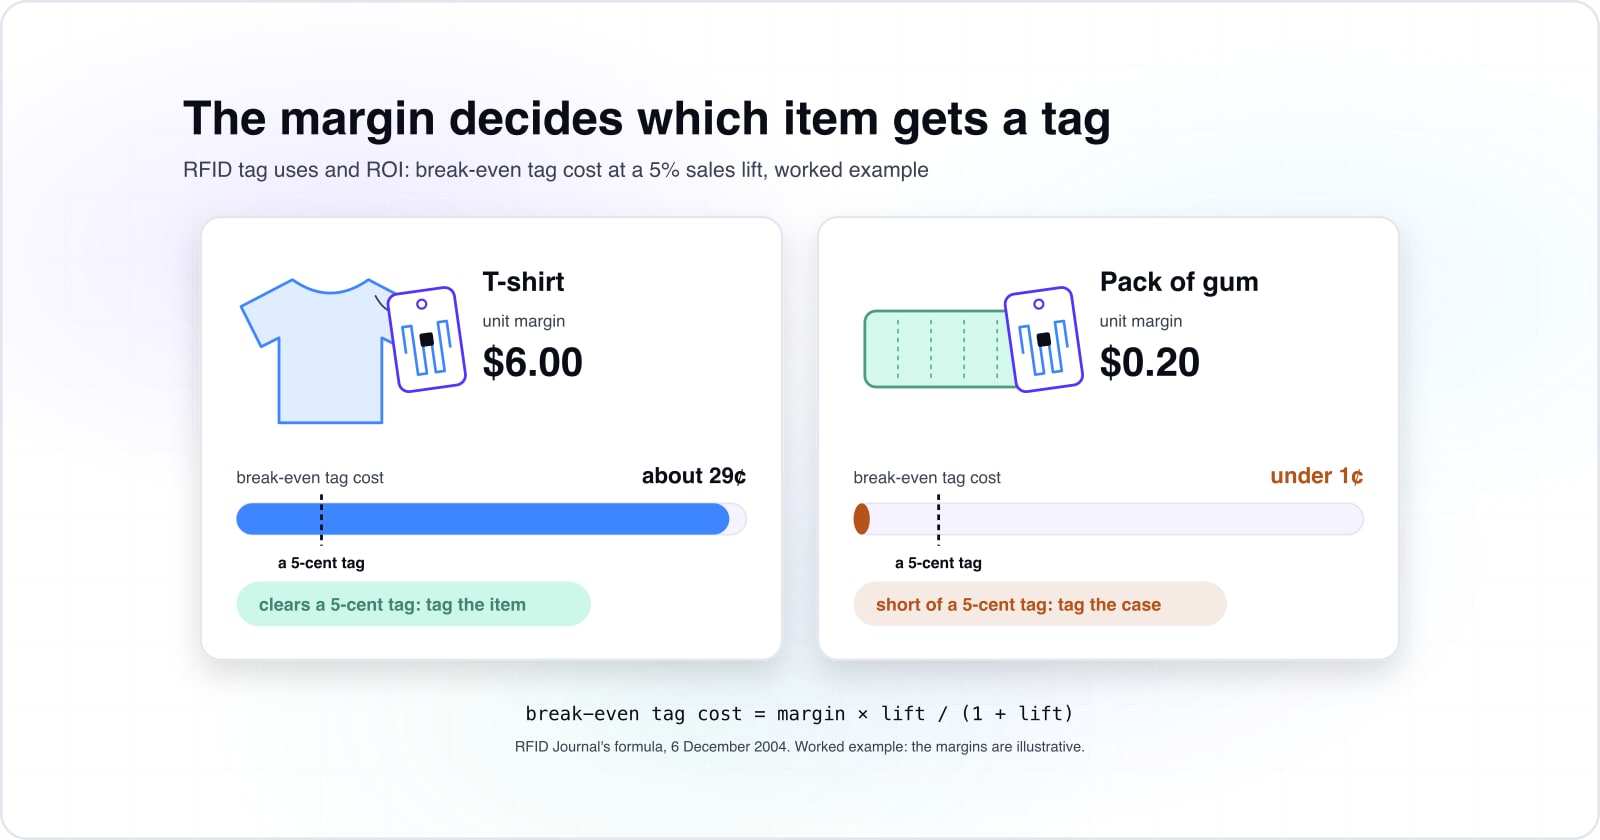
So there are two decisions, in that order. First, the goods and the place pick the family. It may be a shirt label, a tag a phone taps, a tag for steel, or one with a battery. Then the arithmetic picks the items. RFID Journal's formula of 6 December 2004 reads "Tag cost = profit margin X OOS/(1+OOS)", where OOS is the sales lift from fewer out-of-stocks.
Because the formula works per item, one catalogue splits into goods that carry a tag easily and goods that never will.
What return have RFID rollouts reported?#
Ten retailers and brands studied by ECR and GS1 UK, in a report GS1 announced in February 2018, saw sales rise between 1.5% and 5.5% after RFID.
The same GS1 announcement of 21 February 2018 says "All 10 companies achieved a positive ROI from the RFID roll outs". Professor Adrian Beck of the University of Leicester wrote the report. So the return arrives as extra sales, and that lift is the input every later step needs.
1.5%
Low end of the reported sales uplift
5.5%
High end of the reported sales uplift
Every one of the ten saw sales rise, and the lift you plan with belongs inside this range.
| Option | percent sales uplift after RFID |
|---|---|
| Low end of the reported sales uplift | 1.5% |
| High end of the reported sales uplift | 5.5% |
Source: GS1, 2018
A smaller case points the same way. Take our RFID stock tracking build for a software vendor serving small multi-store retailers. There, the client reported an 8% sales increase after the scanning apps were merged. That is the client's own report, not our measurement. Still, it gives a planner a lift to test in the arithmetic.
What types of RFID tags are there?#
RFID tags come in passive UHF, HF and NFC at 13.56 MHz, on-metal UHF, and battery-powered active families, and power and read range are what separate them.
Passive tags have no battery, so they answer on the power of the scanner's radio signal. GS1's tag standards page calls UHF passive tags "the most broadly implemented tags in our industries". In February 2025, the RAIN Alliance said 52.8bn of these RAIN tag chips shipped in 2024. Also, GS1 sets how these ultra high frequency (UHF) tags talk to scanners in its EPC Gen2 air interface standard.
High frequency (HF) and NFC (near field communication) tags work much closer. The NFC Forum puts NFC at "a base frequency of 13.56 MHz with a typical range of up to 2cm". As a result, an NFC tag is read one item at a time, often by a phone.
Then there are two special cases. On-metal tags are UHF tags built to work on steel, where a plain label fails. Active tags carry a battery and send their own signal, so they reach further and cost more.
| Family | Power | Frequency | How it is read |
|---|---|---|---|
| Passive UHF | No battery; powered by the scanner's signal | UHF (GS1 EPC Gen2) | Many items at once, by the shelf |
| HF and NFC | No battery | 13.56 MHz | One item at a time, up to 2cm, often by a phone |
| On-metal UHF | No battery; built to work on steel | UHF | Tools, racks and metal assets |
| Active | Battery; sends its own signal | Varies | Further reach, for yards, containers and vehicles |
Where are RFID tags used, and which type fits each place?#
Passive UHF labels fit apparel and general merchandise, HF and NFC tags fit items read one at a time, on-metal tags fit tools and metal assets, and active tags fit yards and vehicles.
Passive UHF fits goods counted by the shelf. For RFID tags in retail stores, this is the family to price first. In February 2025, the RAIN Alliance tied its growth to mandates for "beauty products, sports equipment and electronics". It also named pharmaceuticals, healthcare, logistics and manufacturing.
NFC fits goods a person taps. The NFC Forum lists "tags in apparel, packaging, and other consumer products" among its uses. So NFC suits a care label, a product page on a phone, or a check on one item.
On-metal tags fit tools, racks and metal assets. Zebra publishes the Confidex Ironside Classic spec sheet, read 16 October 2026. It gives up to 20 m on metal and 8 m on plastic. However, those are theoretical values for a room with no reflections, so a real shop floor reads shorter.
20 m
Mounted on metal
8 m
Mounted on plastic
The same tag reads further on metal than on plastic, so the surface is part of the tag choice.
| Option | metres of theoretical read range at 2 W effective radiated power (ERP), non-reflective environment |
|---|---|
| Mounted on metal | 20 m |
| Mounted on plastic | 8 m |
Source: Zebra Technologies, Confidex Ironside Classic spec sheet, 2026
Active tags fit yards, containers and vehicles. Resource Label Group's tag type guide lists "vehicle tracking, containers, and location monitoring" among active uses. In practice, the place picks the type before cost is counted. So RFID tag use cases follow the goods and the setting, because an unreadable tag returns nothing at any price.
How do you work out the break-even tag cost for one item?#
By RFID Journal's formula, the break-even tag cost is unit margin times sales lift over one plus the lift, so at a 5 percent lift a 5-cent tag needs a margin of $1.05.
Its derivation of 6 December 2004 sets profit with the tag equal to profit without it. Then it solves for the tag cost. So a tag that costs less than the result adds profit, and one that costs more loses it.
Thin margins hit the ceiling first. In the same RFID Journal piece, a 20-cent margin at a 5% lift breaks even below one cent. By contrast, the formula gives about 24 cents of room when the margin is $5.
Show data table
| Item | Value |
|---|---|
| $0.20 unit margin | 0.01 US dollars |
| $0.50 unit margin | 0.024 US dollars |
| $1.05 unit margin | 0.05 US dollars |
| $2.00 unit margin | 0.095 US dollars |
| $5.00 unit margin | 0.238 US dollars |
A 20-cent margin carries under one cent of tag, while a $5 margin carries about 24 cents.
But the formula counts only the sales lift. In RFID Journal's words, it "does not factor in any internal savings". So treat it as a floor, since labour and shrink savings only raise what an item can carry. The RFID ROI calculator below runs the same formula on your own margin, lift and tag quote.
Check your own item against your tag quote
Set the item's unit margin and the sales lift, then replace the tag cost with your own quote. The defaults are the worked example: a $1.05 margin at a 5% lift and a 5-cent tag, which is not a market price. Add the items you tag a year to see the yearly gain or loss.
Break-even tag cost per item
$0.05
- Headroom against your quote (positive clears break-even, negative is a shortfall)
- $0.00
- Smallest unit margin your quote pays back at this lift
- $1.05
- Yearly gain (+) or loss (-) across the items you tag
- Enter items tagged a year
Break-even from RFID Journal's formula of 6 December 2004; enter your own tag quote. Modelled, not measured.
Which items does RFID help most?#
In a University of Arkansas study of 24 stores published in June 2006, RFID cut out of stocks by 62% for items selling 7 to 15 units a day.
Across goods selling 0.1 to 15 units a day, the 2006 Arkansas paper found out-of-stocks fell by 30%. Yet below 0.1 units a day, about one sale every 10 days, "RFID made no difference." Between those ends, its Table 3 shows cuts of 20% to 36%.
| Stage | Value |
|---|---|
| 0.1 to 0.2 units a day | 32 percent |
| 0.2 to 0.3 units a day | 32 percent |
| 0.3 to 0.5 units a day | 20 percent |
| 0.5 to 1 unit a day | 36 percent |
| 1 to 3 units a day | 29 percent |
| 3 to 7 units a day | 32 percent |
| 7 to 15 units a day | 62 percent |
Show data table
| Stage | Value |
|---|---|
| 0.1 to 0.2 units a day | 32 percent |
| 0.2 to 0.3 units a day | 32 percent |
| 0.3 to 0.5 units a day | 20 percent |
| 0.5 to 1 unit a day | 36 percent |
| 1 to 3 units a day | 29 percent |
| 3 to 7 units a day | 32 percent |
| 7 to 15 units a day | 62 percent |
The cut held between 20% and 36% across most bands and reached 62% for items selling 7 to 15 units a day.
So sales speed sits beside margin in the decision. The 2006 authors put it plainly: "fast moving items would be a wiser choice". Therefore the lift you enter for a slow line should be smaller than for a fast one. One caution: above 15 units a day the result was inconclusive, because too few items sold that fast.
How long does an RFID rollout take to pay back?#
In RFID Journal's October 2016 apparel store model, a 20-cent tag paid back in 12 months and a 10-cent tag in 11, and only 4 months when goods averaged $100.
That 2016 model assumed an average selling price of $30, a 52% margin and a 4% gain in overall margin. Then RFID Journal's article moved one input at a time. A 5% margin gain cut payback to 10 months, and a 6% gain cut it to 8.
Show data table
| Item | Value |
|---|---|
| 10-cent tag, 4 percent margin lift | 11 months |
| 20-cent tag, 4 percent margin lift | 12 months |
| 20-cent tag, 5 percent margin lift | 10 months |
| 20-cent tag, 6 percent margin lift | 8 months |
| 20-cent tag, $100 average price | 4 months |
Halving the tag price saved one month, while a $100 average price brought payback down to 4 months.
As a result, the same article says "tag cost is not a key driver of a retailer's return on investment". In its model, halving the tag price saved one month, while item value saved eight. So build the payback model from the benefit lines first: count labour, shrink and sales lost to empty shelves. Then add tags, scanners, software and the work to connect them. Finally, negotiate the tag quote.
Which official pages do you plan the tagging from?#
Plan from the GS1 EPC Gen2 standard for passive UHF, the NFC Forum overview for HF items, an on-metal tag spec sheet, and the printer command that encodes tags in store.
Open them in this order, each for one thing:
- 1
GS1 EPC Gen2 air interface
GS1 EPC Gen2 air interface: the shared standard, so a compliant tag works with any compliant scanner.
- 2
NFC Forum, NFC technology
NFC Forum, NFC technology: the 13.56 MHz frequency and the typical 2cm range of a one-item read.
- 3
Confidex Ironside Classic spec sheet
Confidex Ironside Classic spec sheet: read range by surface, and how to mount on metal.
- 4
Zebra ZPL ^RF command
Zebra ZPL ^RF command: how a printer writes the EPC (Electronic Product Code, the tag's item number) as a label prints.
The four pages, in order: GS1 EPC Gen2 air interface, NFC Forum, NFC technology, Confidex Ironside Classic spec sheet and Zebra ZPL ^RF command.
What is the smallest code that checks which items can carry a tag?#
The smallest useful check is one JavaScript function that computes each item's break-even tag cost and compares it with the tag quote you enter.
It takes three steps. First, compute each item's break-even with RFID Journal's formula. Second, subtract your tag quote to get the headroom. Then keep items with headroom that sell at least 0.1 units a day, best first. Save it as tag-list.mjs and run it with Node, passing your tag cost in dollars.
// Sales lift as a decimal. GS1's 2018 report saw 1.5% to 5.5%.
const lift = 0.05;
// Your own tag quote in dollars per item, passed on the command line.
const tagCost = Number(process.argv[2]);

// Illustrative rows; load your catalogue export here instead.
const catalogue = [
  { sku: "TEE-01", margin: 6.0, unitsPerDay: 4 },
  { sku: "GUM-12", margin: 0.2, unitsPerDay: 9 },
  { sku: "LAMP-3", margin: 18.0, unitsPerDay: 0.05 },
];

// Step 1: break-even tag cost, RFID Journal (6 December 2004).
const breakEven = (margin) => (margin * lift) / (1 + lift);

// Steps 2 and 3: headroom, then keep and sort the items that clear it.
const tagList = catalogue
  .map((item) => ({ ...item, headroom: breakEven(item.margin) - tagCost }))
  .filter((item) => item.headroom > 0 && item.unitsPerDay >= 0.1)
  .sort((a, b) => b.headroom - a.headroom);

console.log(tagList);
With these illustrative rows, the T-shirt breaks even at about 29 cents, so it stays for most quotes. However, the gum breaks even under one cent and the lamp sells too slowly, so both drop off.
When is tagging an item the wrong fit?#
Tagging is the wrong fit when an item's margin cannot cover the tag, when it sells under 0.1 units a day, or when no family reads reliably on it.
Where should you go next?#
Once the tagging list is settled, the next questions are what a scan proves, how RFID fits an inventory product, and how one app reads every handheld.
First, why an RFID scan is not a stock count covers what tag reads prove. Then adding RFID to inventory software covers the product side. Also, one Android app for several RFID reader SDKs covers the handhelds.
To have a system built around the tag data, see custom software development. For the scanning app, see mobile app development. Still, the break-even formula and the four pages above are enough to build your own tagging list.