Caddy reverse proxy load balancing: what one dead backend shows about health checks
Listing two app servers behind Caddy looks like failover, but it is not until three settings are on. A short test on a laptop shows what each one buys, in failed requests and in seconds.
What does a Caddy reverse proxy do when one backend dies?#
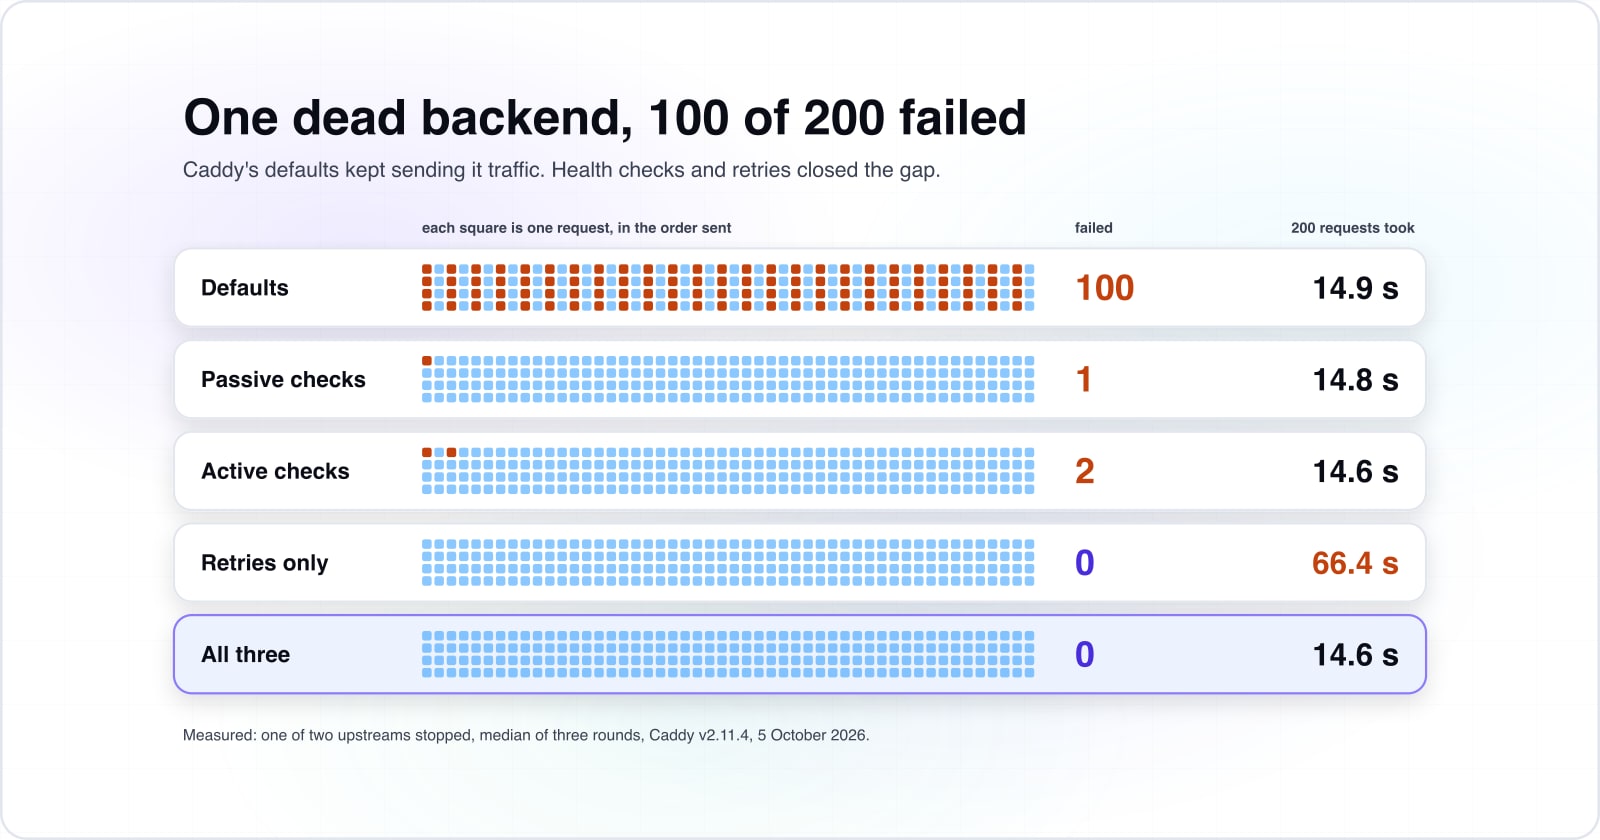
With no health checks, a Caddy reverse proxy keeps sending traffic to a dead backend, and our two-backend test failed 100 of 200 requests until checks were on. That test ran on Caddy v2.11.4 on 5 October 2026. The Caddy reverse_proxy documentation says load balancing "is enabled by default, with the random policy." It also says retries are off by default. As a result, a list of upstreams spreads load, but nothing takes a dead one out of the turn.
In our test of 5 October 2026, each fix closed most of the gap, and the three together closed all of it.
Show data table
| Item | Value |
|---|---|
| no checks or retries (round_robin) | 100 |
| passive (fail_duration 30s, max_fails 1) | 199 |
| active (health_interval 2s) | 198 |
| retries only (lb_try_duration 5s) | 200 |
| all three | 200 |
With no checks, half the requests failed; any one of the three settings recovered nearly all of them.
What does each failover setting cost in failed requests and waiting time?#
In our test, retries alone saved every request but stretched 200 requests from 14.9 to 66.4 seconds, while health checks removed the wait. Atyantik ran that test on 5 October 2026, and it frames the real choice. Without checks, a user either sees an error or waits while Caddy tries the next server. However, with checks in front of retries, the dead server leaves the pool and the wait mostly goes away too.
14.9 s
Defaults, no checks or retries
66.4 s
Retries only, lb_try_duration 5s
Retries hide the error but charge the time.
Median of three rounds, Caddy v2.11.4.
| Option | seconds to finish 200 requests with one of two backends stopped |
|---|---|
| Defaults, no checks or retries | 14.9 s |
| Retries only, lb_try_duration 5s | 66.4 s |
Source: Atyantik failover test, Caddy v2.11.4, 5 October 2026
The gap in our 5 October 2026 test is 51.5 seconds over 200 requests, about a quarter second each. In particular, that matches the 250ms wait between tries, the lb_try_interval default on Caddy's reverse_proxy page.
The active check interval decides how long a dead server keeps getting traffic. Say a site takes 20 requests a second, an illustrative load. For example, a 30s interval, the default, then lets up to 600 requests arrive between two checks. Since round_robin sends half of them to the dead server, up to 300 fail. At 2s, the same sum gives at most 20. Meanwhile, passive checks or a retry window catch the ones in between.
Requests sent to a dead upstream between two checks
Set your request rate, the health_interval and the number of upstreams; it gives the worst case before the next active check marks the server down.
Worst-case requests to the dead upstream
300
- Requests arriving between two checks
- 600
An illustrative model of the worked example above, not a measurement.
Which lb_policy should the upstreams use?#
Caddy picks an upstream at random unless lb_policy says otherwise, and round_robin, least_conn, first, ip_hash and cookie cover most backends. In practice, the choice follows how the backend keeps state.
- round_robin "iterates each upstream in turn". It suits identical, stateless app servers.
- least_conn picks the upstream "with fewest number of current requests". It suits uneven request times.
- ip_hash and cookie pin a client to one upstream. They suit apps that keep sessions in memory.
- first sends everything to the first available upstream, for a primary with a standby.
However, the docs warn about first: "remember to enable health checks along with this, otherwise failover will not occur." That warning applies to every policy, as the test above shows.
How do active and passive health checks differ?#
Active checks probe health_uri every health_interval, 30s by default, while passive checks judge real requests and only switch on when fail_duration is set. First, as the Caddy reverse_proxy page describes them, active checks find a dead server on a timer. Second, passive checks find it on the first failed request, because they "happen inline with actual proxied requests", in the words of the Caddy docs.
| Item | Caddy reverse_proxy default value |
|---|---|
| health_interval (seconds) | 30 |
| health_timeout (seconds) | 5 |
| health_fails (checks) | 1 |
| health_passes (checks) | 1 |
| lb_try_interval (ms) | 250 |
| max_fails (requests) | 1 |
Each kind covers the other's blind spot. For example, a passive check learns only from real traffic, so it always costs at least one failed request. An active check, meanwhile, misses everything between two probes. That is why, in our 5 October 2026 test, the passive run lost exactly 1 request. Then the active run lost 2, because it needed a probe to land.
Also note that fail_duration defaults to 0, which means passive checks are off. Once it is set, max_fails counts failures inside that window.
What do lb_try_duration and lb_retries change?#
lb_try_duration holds a request while Caddy tries another upstream, waiting lb_try_interval, 250ms by default, between tries. Instead of a time, lb_retries sets a count of tries, according to the same Caddy reverse_proxy page. When both are set, the reverse_proxy page says "the retry duration takes precedence over the retry count."
Show data table
| Item | Value |
|---|---|
| defaults | 14.9 |
| passive | 14.8 |
| active | 14.6 |
| retries only | 66.4 |
| all three | 14.6 |
Only retries without checks stretched the run, to 66.4 seconds.
In short, retries turn a failed request into a slow one. Therefore they belong behind health checks, which keep the dead backend out of the pool. With all three on, our test of 5 October 2026 finished in 14.6 seconds. That is the same as the active run, and it still failed nothing.
The Caddy docs suggest 5s as a starting point for lb_try_duration, because the default dial timeout is 3s. As a result, that leaves room for one more try after a slow connect.
What does a complete Caddyfile for load balancing look like?#
One short site block gives automatic HTTPS, two upstreams, a policy, active and passive checks and a retry window. These are the values the test measured, behind a real domain name instead of a test port.
example.com {
	reverse_proxy app1:8080 app2:8080 {
		# 1. spread requests in turn
		lb_policy round_robin

		# 2. active checks: probe every 2s, give up on a probe after 1s
		health_uri /
		health_interval 2s
		health_timeout 1s

		# 3. passive checks: one failed request marks a server down for 30s
		fail_duration 30s
		max_fails 1

		# 4. hold a request up to 5s while another upstream is tried
		lb_try_duration 5s
	}
}
Also, the site address does the TLS work. Because the block names a public domain, Caddy gets a certificate from Let's Encrypt or ZeroSSL. It also redirects HTTP to HTTPS, as the automatic HTTPS page describes. Point health_uri at a real health route, such as /healthz, when the app has one. Finally, run caddy run beside the Caddyfile and check it with curl -I https://example.com.
How can the failover test be rerun on one machine?#
Two small Python servers, one Caddy on a spare port, one stopped server and a curl loop reproduce the whole measurement on a laptop. Here is the harness, cut to its core.
# upstream.py answers 200 on any GET; start two of them
python3 upstream.py 19001 & A=$!
python3 upstream.py 19002 & B=$!
caddy run --config Caddyfile.test --adapter caddyfile & C=$!
sleep 2
kill $B   # stop one backend
for i in $(seq 1 200); do
  curl -s -o /dev/null -w '%{http_code}\n' http://127.0.0.1:18080/
  sleep 0.025
done | sort | uniq -c   # count of each status code
kill $C $A
Caddyfile.test sets auto_https off and listens on :18080. It carries the same reverse_proxy block as above, with the two local ports as upstreams. After that, change one setting at a time and run each three times.
Show data table
| Item | Value |
|---|---|
| defaults | 2 |
| passive | 2 |
| active | 3 |
| retries only | 266 |
| all three | 252 |
Only the two setups with retries had a slowest request near the 250ms retry interval.
The slowest request tells the same story. In our test of 5 October 2026, both setups with retries had a slowest request near 250ms, the retry interval. By contrast, the runs without retries stayed at 2 or 3ms.
Which Caddy documentation pages does the build follow?#
The Caddy documentation covers the build in this order: the reverse proxy quick start, the reverse_proxy directive, automatic HTTPS and the admin API.
- Step 1
Reverse proxy quick start
- Step 2
reverse_proxy directive
- Step 3
Automatic HTTPS
- Step 4
Admin API
- Reverse proxy quick start: the smallest site block,
reverse_proxy :9000. - reverse_proxy directive: lb_policy, the health check options and the retry options.
- Automatic HTTPS: how certificates are issued and stored, and the staging endpoint for tests.
- Admin API:
POST /load, which the docs say incurs "zero downtime" and rolls back if the new config fails.
How do several Caddy instances share TLS certificates?#
Caddy instances that point at the same storage share certificates and coordinate renewals as a cluster, so a second proxy needs shared storage, not a second ACME account. The automatic HTTPS page says such instances "coordinate certificate management as a cluster." In short, a Caddy cluster is a set of instances on one shared storage.
Scaling the proxy tier itself means two things. First, shared certificate storage. Second, something in front that spreads traffic across the Caddy instances. When that front layer works at the TCP level, Caddy proxy protocol support, the proxy_protocol transport option, can pass the real client IP onward. The reverse_proxy page notes it is "best paired with" the trusted_proxies setting.
What does the nginx upstream module document about failed servers?#
The nginx upstream module marks a server unavailable after max_fails failures within fail_timeout, defaults 1 and 10 seconds, and active health_check sits in the commercial subscription. The upstream module page adds that with a single server in a group, "such a server will never be considered unavailable."
| Setting | nginx upstream default | Caddy reverse_proxy default |
|---|---|---|
| max_fails (attempts) | 1 | 1 |
| failure window (seconds) | fail_timeout 10 | fail_duration 0, passive checks off |
So open-source nginx does passive failover much as Caddy's passive checks do. However, the documented difference runs both ways. In nginx, passive accounting is on by default, while Caddy needs fail_duration set. In Caddy, active checks come with the free server. By contrast, the nginx health check module says it "is available as part of our commercial subscription." Finally, for reloads, the nginx control page says a HUP signal starts new workers and shuts the old ones down gracefully.
When is Caddy the wrong tool for load balancing?#
A dedicated load balancer such as HAProxy earns its place when checks need rise and fall thresholds, servers must drain through a runtime API, or the proxy tier itself needs balancing. Caddy has thresholds too, health_passes and health_fails, both 1 by default. By contrast, the HAProxy 3.0 manual sets fall to 3 and rise to 2 unless told otherwise.
| Setting | HAProxy server check default | Caddy reverse_proxy default |
|---|---|---|
| check interval | inter 2000 ms | health_interval 30 s |
| failed checks to mark down | fall 3 | health_fails 1 |
| passed checks to mark up | rise 2 | health_passes 1 |
Three cases point away from Caddy as the balancer:
- Servers drained one at a time from scripts. The HAProxy management guide documents
set server <backend>/<server> state drain. That state "only removes the server from load balancing" while checks go on. In Caddy, the same change is a new config sent to the admin API. - Several Caddy instances that need a balancer of their own. Here HAProxy or a cloud load balancer in front, with PROXY protocol, is the better shape.
- Many services in Kubernetes that come and go. There, an ingress controller fits better than a hand-kept upstream list, as the Rancher on DigitalOcean Kubernetes post shows.
Traffic volume alone is not the signal. Instead, these needs are.
Where to go next#
Rerun the test with your own health_interval, then read the posts on HTTP/2 upstreams, edge placement and Kubernetes ingress. The Node.js HTTP/2 server post covers the backend side of the proxy. Also, the post on what belongs at the edge helps decide where the proxy tier should sit. When the proxy tier, its checks and its deploys need to be built and run as one, that is DevOps and CI/CD work. Watching upstream health after launch falls under maintenance and support. Still, the Caddy documentation and a short test are enough to get a two-server pool right on your own.