What is a CPU cache? Why it beats RAM, proven in one number you can reproduce
A cache hit answers in about 1 nanosecond, DRAM in about 61.5. This is the causal chain behind that 62x gap, from the SRAM latch and the DRAM refresh stall to a benchmark you run yourself.
What is a CPU cache, and why is it faster than RAM?#
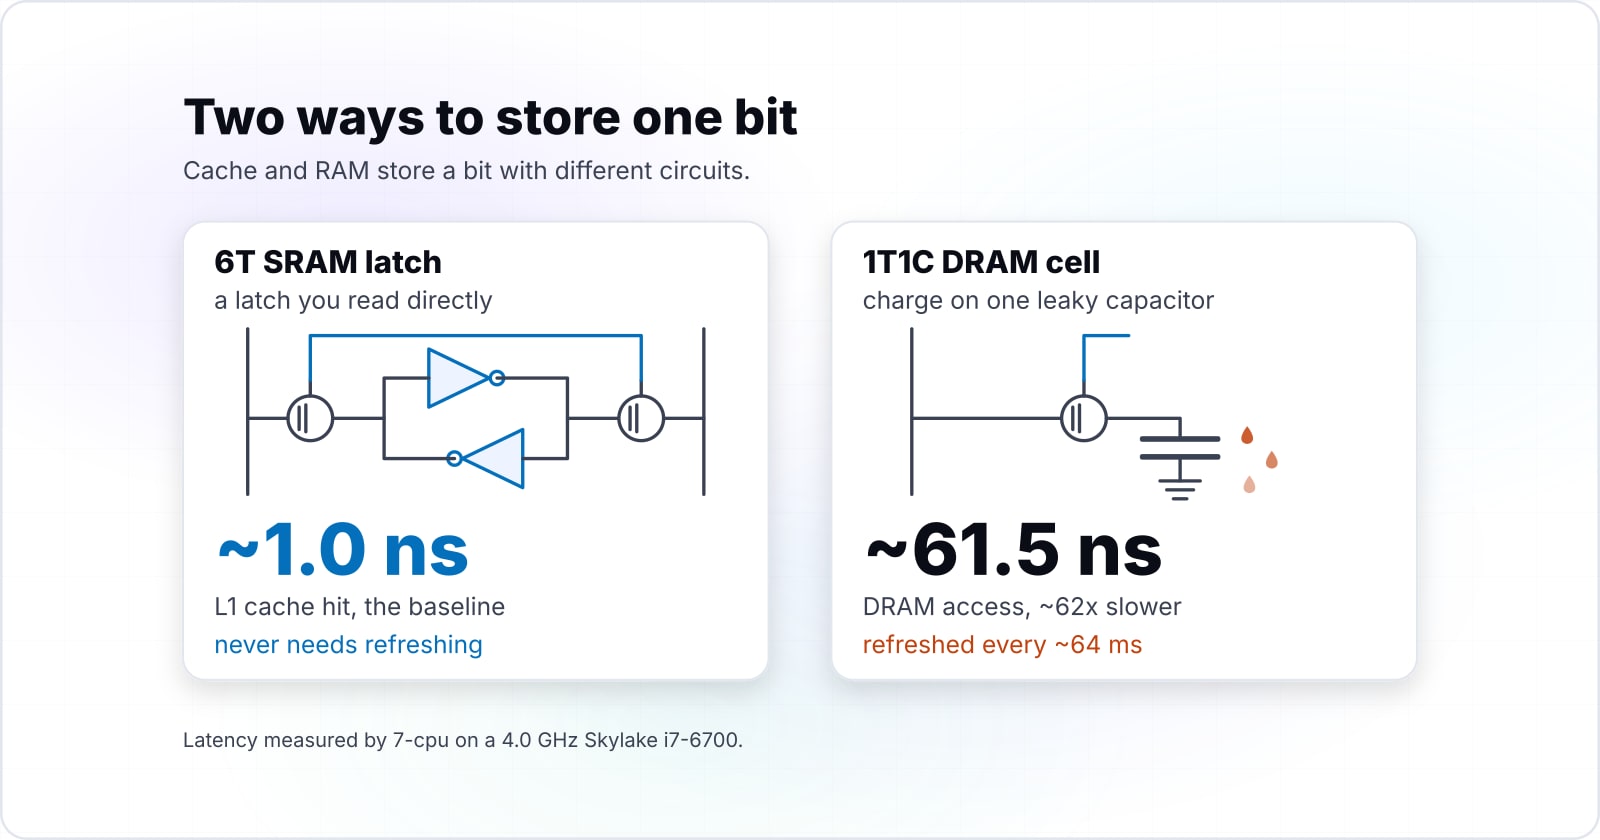
What is a CPU cache? It is a small store of fast SRAM on the processor die that keeps recently used data beside the cores, so most loads never travel out to RAM. Most explainers stop at "cache is closer and smaller". That is true, yet it explains nothing you can act on. Instead, start with the measurement and work backwards to its cause. On a Skylake i7-6700 an L1 hit costs about 1 nanosecond, and a DRAM read costs about 61.5. That single ratio is the whole thesis, and every section below earns it.
~1.0 ns
L1 cache hit
~61.5 ns
DRAM access
An L1 hit answers in about 1 nanosecond; the same load from DRAM costs about 61.5. That is roughly 62 times slower for identical work, measured on a 4.0 GHz Skylake i7-6700 by 7-cpu.
Show data table
| Option | access latency (nanoseconds) |
|---|---|
| L1 cache hit | ~1.0 ns |
| DRAM access | ~61.5 ns |
The claim, and how the rest of this page proves it#
So what is a CPU cache doing that RAM cannot? It avoids two independent penalties that add up. The first is the cell. The second is the distance. Because both are physical, both are measurable, and neither is a vendor talking point. The chain runs in five links. First the transistor, then the DRAM timing, next the on-die signal path, then a benchmark you run, and finally a table that maps each symptom to a fix. Read the map once and no later section is a surprise.
How fast is each level of the memory hierarchy?#
Latency climbs at every level, from 4 cycles for an L1 hit to 12 for L2, 42 for L3, and 42 cycles plus 51 ns for DRAM on a Skylake i7-6700. Before the physics, here is the ground truth every top result leaves scattered across ten pages. This table gathers the whole hierarchy for one named chip. Each row lists the latency in cycles and nanoseconds, the typical capacity, and a rough bandwidth. Read it top to bottom and the cost of distance is already visible.
| Level | Latency (cycles) | Latency (ns) | Typical capacity | Rough bandwidth |
|---|---|---|---|---|
| Register | in-core | ~0.25 ns | ~2 KB register file | reads every cycle |
| L1 cache | 4 cyc | ~1.0 ns | 32 KB per core | ~200 GB/s |
| L2 cache | 12 cyc | ~3.0 ns | 256 KB per core | ~80 GB/s |
| L3 cache | 42 cyc | ~10.5 ns | 8 MB shared | ~40 GB/s |
| DRAM | 42 cyc + 51 ns | ~61.5 ns | gigabytes | ~10.8 GB/s |
Reading each row: the physical cause behind the number#
That single table is the spine of why CPU cache is faster than RAM. Notice the shape of the jump. From L1 to L3 the latency grows about tenfold, yet it stays on-die. From L3 to DRAM it grows sixfold again, because the request now leaves the chip. Meanwhile the capacity moves the opposite way, from kilobytes to gigabytes. That trade is not an accident. It is forced by the storage cell, which is where the next section begins.
Why is SRAM cache faster than DRAM?#
SRAM holds each bit in a 6-transistor latch you read directly, while DRAM stores it as charge on one leaky capacitor that must be refreshed and rewritten after every read. The deepest reason why CPU cache is faster than RAM lives in the storage cell itself. Cache and RAM store a bit with different circuits, and that single choice sets everything downstream. So look at the two cells side by side. One is built for speed, the other for density, and you cannot have both in one cell.
- Cross-coupled latchTwo inverters wired back to back actively hold the stored bit. It stays put with no refresh, which is why an SRAM read is just a couple of cycles.
- Access transistorsA pair of transistors connect the latch to the bit lines. You read the held value directly, with nothing to reconstruct.
- Six transistors per bitThe whole cell costs six transistors. That is fast but large and power-hungry, so SRAM stays small: kilobytes, not gigabytes.
- Storage capacitorA single tiny capacitor holds the bit as charge. Charge leaks away in milliseconds, so the cell forgets unless it is refreshed.
- One access transistorOne transistor gates the capacitor onto the bit line. One transistor plus one capacitor is tiny, so DRAM packs gigabytes cheaply.
- Destructive readReading drains the capacitor, so the value must be written back every time, and every row must be refreshed on a timer.
The 6T SRAM cell: a latch you read directly#
An SRAM cell is a latch. Two inverters feed each other, so the pair holds one stable bit as long as power is on. Because the bit is held actively, nothing has to be refreshed. The value is also read straight off the latch through two access transistors, with no reconstruction step. That is why a cache hit resolves in a handful of cycles. The cost is size. Six transistors per bit is bulky and power-hungry, so SRAM stays measured in kilobytes.
The 1T1C DRAM cell: one capacitor, and why it leaks#
A DRAM cell stores a bit as charge on one capacitor, gated by one transistor. One transistor plus one capacitor is tiny, so DRAM packs gigabytes onto a die cheaply. However that density has a price. Charge leaks away within milliseconds, so the controller must refresh every row on a fixed timer or the data rots. Reading the cell also drains the capacitor, which makes the read destructive. Consequently every read is followed by a write-back, and that hidden work is where the stall begins.
Where the stall is born: RAS, CAS, precharge, refresh#
Competitors say "DRAM is slower" and stop. Instead, watch the slowness happen. A DRAM read on a fresh row is not one action. It is a sequence: activate the row with a row address strobe (RAS), select the column with a column address strobe (CAS), move the bytes, precharge the row back, and share time with refresh. Step through it below and watch the roughly 51 nanosecond penalty accumulate, one phase at a time.
Why one DRAM read costs about 51 ns
A cache hit reads a latch and returns. A DRAM read cannot. It must activate a row, select a column, move the bytes across the bus, precharge the row back, and share time with periodic refresh. Step through the five phases and watch the 51 ns add up.
Each phase of a DRAM row miss below adds to the running total. Press Next to open the row.
None of that work exists for a cache hit. An SRAM latch has no row to activate, no column to select, and no charge to restore. Therefore the DRAM penalty is not a bigger version of a cache access. It is extra machinery that a cache simply does not run.
Why does distance make RAM slower than cache?#
L1 sits beside the execution units, while a DRAM request must queue at the memory controller, wait for the shared bus, and leave the chip. Distance is the second half of why CPU cache is faster than RAM. Even at the speed of light, signals take time to cross a chip, and more time to leave it. So the physical layout of the parts sets a floor on latency that no cleverness removes. Trace the path from the execution units out to DRAM and the cost of each hop becomes concrete.
Why L1 sits beside the ALU and DRAM sits across a bus#
L1 is tiny for a reason. A small array can sit right next to the execution units, so its wires are short and its lookup is quick. As the caches grow they must sit farther out, which is why L2 and L3 each cost more cycles. Past L3 the picture changes in kind, not degree. Now the request queues at the memory controller, waits its turn for the shared bus, and travels off-chip. Because that arbitration and travel are serial, they add cycles that on-die caches never pay.
How can you measure cache latency on your own machine?#
Run a pointer-chase benchmark that times one dependent load at every working-set size, and its output draws the L1, L2, L3, and DRAM knees. Numbers you cannot reproduce are just claims. So here is the load-bearing part. Those knees land where the latency table predicts. Build it, run it, and compare your knees to the plot.
The pointer-chase microbenchmark, line by line#
The trick is a dependent load. Each step reads a pointer that tells you the next address, so the CPU cannot prefetch ahead. As the working set grows past each cache, the average access falls out of that level and latency jumps. The strided variant does the opposite job. It exposes conflict misses by hammering the same cache set with a power-of-two stride. The third tab reads the cache topology straight from an Apple M1.
// latency.c -- a pointer-chase microbenchmark.
// Build: cc -O2 -o latency latency.c
// Run:   ./latency
#include <stdio.h>
#include <stdlib.h>
#include <time.h>

// One dependent load per step: p = *p. The chain is a single random cycle,
// so the prefetcher cannot guess the next address. We measure pure access
// latency, never bandwidth.
static double chase(size_t bytes, long iters) {
    size_t n = bytes / sizeof(void *);
    void **a = malloc(n * sizeof(*a));
    for (size_t i = 0; i < n; i++) a[i] = (void *)&a[i];

    // Sattolo's algorithm links every slot into one big cycle.
    for (size_t i = n - 1; i > 0; i--) {
        size_t j = (size_t)rand() % i;
        void *t = a[i]; a[i] = a[j]; a[j] = t;
    }

    void **p = &a[0];
    struct timespec t0, t1;
    clock_gettime(CLOCK_MONOTONIC, &t0);
    for (long i = 0; i < iters; i++) p = (void **)*p;
    clock_gettime(CLOCK_MONOTONIC, &t1);

    __asm__ volatile("" :: "r"(p)); // keep p live; defeat dead-code removal
    free(a);
    double ns = (t1.tv_sec - t0.tv_sec) * 1e9 + (t1.tv_nsec - t0.tv_nsec);
    return ns / iters;
}

int main(void) {
    for (size_t kb = 4; kb <= 512L * 1024; kb *= 2)
        printf("%8zu KB  %6.2f ns/access\n",
               kb, chase(kb * 1024, 50L * 1000 * 1000));
    return 0;
}// strided.c -- a strided sweep to expose conflict misses.
// Touch one byte every STRIDE bytes, then wrap. A power-of-two stride maps
// many accesses onto the same cache set, so conflict misses show up as a
// latency cliff even when the whole array fits L2.
static double sweep(size_t bytes, size_t stride, long iters) {
volatile char *a = calloc(bytes, 1);
size_t mask = bytes - 1; // bytes is a power of two
size_t off = 0;
long acc = 0;
struct timespec t0, t1;
clock_gettime(CLOCK_MONOTONIC, &t0);
for (long i = 0; i < iters; i++) {
acc += a[off];
off = (off + stride) & mask;
}
clock_gettime(CLOCK_MONOTONIC, &t1);
__asm__ volatile("" :: "r"(acc));
free((void *)a);
double ns = (t1.tv_sec - t0.tv_sec) * 1e9 + (t1.tv_nsec - t0.tv_nsec);
return ns / iters;
}# Apple M1: read the cache topology the OS exposes, then cross-check 7-cpu.
$ sysctl hw.cachelinesize \
hw.perflevel0.l1dcachesize \
hw.perflevel0.l2cachesize
hw.cachelinesize: 128
hw.perflevel0.l1dcachesize: 131072 # 128 KB L1 data cache
hw.perflevel0.l2cachesize: 12582912 # 12 MB L2, shared by 4 performance coresOn the Skylake box the pointer chase prints about 1 ns while the working set fits L1, then rises through roughly 3 ns and 10.5 ns, and finally settles near 61.5 ns once the data spills to DRAM. In practice those four plateaus are the knees. They are the physical hierarchy, printed by your own terminal.
The knees you should see (and how to read them)#
The plot below is the interactive twin of that benchmark. Sweep the working-set slider and a marker walks the curve, naming the level and the latency at each size. Switch the CPU preset and the knees jump to that chip's cache sizes, because an Apple M1 has a 128 KB L1 and a 12 MB L2 rather than Skylake's 32 KB and 8 MB. This is where prediction meets measurement.
Drag the working-set slider to walk the curve. Switch the CPU to move the knees.
| Level | Fits up to | Latency (cycles) | Latency (ns) |
|---|---|---|---|
| L1 | 32 KB | 4 cyc | ~1 ns |
| L2 | 256 KB | 12 cyc | ~3 ns |
| L3 | 8 MB | 42 cyc | ~10.5 ns |
| DRAM | beyond last cache | 42 cyc + 51 ns | ~61.5 ns |
How much slower is random memory access than sequential?#
Roughly 165 times slower for the same 256 MiB array, because a sequential sum stays bandwidth-bound while a random dependent chase pays full DRAM latency each time. Here is the payoff the physics was building toward. Take one 256 MiB array of 32-bit integers, which is far larger than the 8 MB L3. Sum it in order and the run is bandwidth-bound at about 24.9 ms. Then chase the same elements in a random dependent order and the run takes about 4.13 seconds. That is the same arithmetic, roughly 165 times slower, purely from destroying locality.
24.9 ms
Sequential sum (locality kept)
4.13 s
Random pointer-chase (locality destroyed)
A sequential sum runs bandwidth-bound at ~0.37 ns per element, because the 64 B line plus the prefetcher serve 15 of every 16 accesses from L1. A random dependent chase pays the full ~61.5 ns DRAM latency each time, so identical work runs about 165 times slower.
Show data table
| Option | wall-clock time (milliseconds) |
|---|---|
| Sequential sum (locality kept) | 24.9 ms |
| Random pointer-chase (locality destroyed) | 4.13 s |
Cache lines and prefetch: why sequential is nearly free#
Memory never moves one byte. It moves a whole 64-byte line. So when you read one integer, the next fifteen arrive with it, already in L1. The hardware prefetcher also spots a sequential pattern and fetches the next line before you ask. Because of those two effects, a sequential scan hits L1 about fifteen times out of sixteen, which is the 0.37 ns per element above. Random access defeats both, and you pay full DRAM latency on nearly every step.
Associativity and the power-of-two-stride conflict-miss cliff#
Associativity sounds abstract until a loop hits it. A cache maps each address to a small set of slots. When you walk memory with a power-of-two stride, many addresses fall into the same set, so they evict each other even though the array fits in the cache. That is a conflict miss, and it shows up as a latency cliff in the strided benchmark. The fix is small: offset the array or pad the stride so accesses spread across sets.
AoS vs SoA and false sharing, as measured slowdowns#
Data layout is a latency decision in disguise. Store an array of structs and a loop that reads one field still drags the whole struct through cache. Switch to a struct of arrays and that field becomes contiguous, so a single line now carries eight useful values. Compare the two below, then look at the magnitudes.
// Array of structs: each particle is 64 bytes, but the hot loop reads only x.
// Every step drags 56 bytes of cold fields into cache alongside the one it uses.
struct particle { double x, y, z, vx, vy, vz, mass, pad; };
struct particle *p = malloc(N * sizeof *p);

double sum = 0;
for (size_t i = 0; i < N; i++)
sum += p[i].x; // 1 useful field per 64 B cache line// Struct of arrays: x lives in its own tight array. Now a 64 B line carries
// eight consecutive x values, so the same loop touches 8x fewer cache lines.
struct particles { double *x, *y, *z, *vx, *vy, *vz, *mass; };
struct particles p = alloc_particles(N);
double sum = 0;
for (size_t i = 0; i < N; i++)
sum += p.x[i]; // 8 useful doubles per 64 B cache lineShow data table
| Item | Access cost per element |
|---|---|
| Sequential (struct of arrays) | 0.37 ns/element |
| Array of structs (1 field per line) | 3 ns/element |
| Random pointer-chase | 61.5 ns/element |
Sequential and random are the measured 0.37 and 61.5 ns/element figures; the array-of-structs bar is an illustrative middle case, since reading one of eight fields wastes seven eighths of every 64 B line.
False sharing is the multi-thread version of the same problem. Two threads that update separate counters on the same 64-byte line force the cache-coherence protocol to bounce that line between cores. As a result, adding threads makes the code slower, not faster. Pad each counter onto its own line and the contention disappears.
How do you fix code that is slowed by cache misses?#
Match the symptom you observe to the memory level that binds you, then apply the fix for that level in code. Physics is only useful when it changes your code. So here is the translation layer no competitor provides. Each row is a pattern you have probably already hit.
| Symptom you observe | Which level binds you | The fix in code |
|---|---|---|
| Column-major walk of a row-major array is slow | DRAM (locality destroyed) | Traverse in memory order; block or tile the loops so each tile fits L2 |
| Random-key lookups hit a latency wall | DRAM (dependent misses) | Sort or batch by key; pack hot fields together as a struct of arrays |
| Adding threads makes a shared counter slower | Cache coherence (false sharing) | Pad each counter to its own 64 B line; aggregate per thread, combine once |
| A loop that fits L2 still stalls on a fixed stride | L2 (conflict misses) | Offset the array or pad the stride so accesses spread across sets |
When should you not optimize for the cache?#
Skip it when a profiler shows you are compute-bound, when the working set already fits L2, or when the code is not hot. Locality tuning is not free, and it is not always the answer. It makes code more complex, so spend it only where a measurement says the memory system is the bottleneck. Reach for it in the wrong place and you trade readable code for no speedup.
Further reading and sources#
Every figure here traces to a primary source. Ulrich Drepper's What Every Programmer Should Know About Memory, dated 21 November 2007, is still the canonical treatment of the SRAM and DRAM cells and the refresh timing. The measured latencies come from 7-cpu's Skylake and Apple M1 pages, which I cross-checked against a local sysctl read on this M1. For cache organization and prefetch behavior, Agner Fog's microarchitecture manual (last updated 23 May 2026) and instruction tables are the reference, alongside the Intel optimization manuals. For a feel of the orders of magnitude over time, Colin Scott keeps the Latency Numbers Every Programmer Should Know interactive.
So, what is a CPU cache, and why is it faster than RAM? Now you can answer both from your own terminal, not from a slogan. This sits next to the rest of the low-level work we write about. If dependent-load timing interested you, our walkthrough of how computers generate random numbers one decision at a time traces a similar hardware-to-API path. The same latency budgeting drives the network, which is why what happens in the milliseconds after you hit a URL is the companion read. For another number every program leans on without seeing it, Unix time explained from one equation derives the counter behind every timestamp. And once the working set is a database, the same cache math explains many common MySQL performance bottlenecks and how to fix them. When a hot path in your own product is memory-bound, this profiling is where our web performance work starts, and our backend developers apply the same data-layout fixes in production code.
Questions this post answers
What is a CPU cache?
How much faster is CPU cache than RAM?
Why is CPU cache faster than RAM?
Why does DRAM need to be refreshed?
What is a cache line?
What is false sharing?
Memory-bound code is quiet until a workload grows and a loop that used to fit cache suddenly does not. If you want a second set of hands profiling a hot path, redesigning a data layout, or tracking down where locality leaked out of a system, our software engineering team is glad to help. No pressure and no lock-in.
Talk to our software engineering team