Custom software development timeline: how long each phase takes and what stretches it
Most plans for new software add up the phases and stop there. The finish date depends on five things a phase table never shows, and you can score all five before anyone signs the plan.
How long does a custom software development timeline really run?#
A custom software development timeline is the phase plan plus the drift, and software projects run around 30 to 40% over their planned time on average. That figure opens a 2023 study by Delft University of Technology and ING, presented at ESEC/FSE in San Francisco from 3 to 9 December 2023. Its words are "Software projects run, on average, around 30-40% overtime". The paper does not measure that figure itself; it cites two earlier reviews of estimation research. Then the study follows real deliveries at the bank to see where the extra time goes.
The phase plan most vendors publish looks tidy. For example, Pravaah Consulting's 2026 guide gives discovery 2 to 4 weeks and design 2 to 6. It gives development 8 to 24 weeks, testing 2 to 6 and deployment 1 to 3. So the phases add up to 15 to 43 weeks, or roughly four to ten months.
However, that sum is a plan, not a finish date. The drift sits on top of it, and it does not land evenly. Five drivers decide where it lands: integration surface, data migration, decision latency, scope and team. Because each one stretches a known phase, each one also tells you what to start early. This guide takes the phases first, then the measured drift, then the five drivers. Finally, it ends with a way to score your own project.
| Phase | Weeks |
|---|---|
| Discovery | 2 to 4 |
| Design | 2 to 6 |
| Development | 8 to 24 |
| Testing | 2 to 6 |
| Deployment | 1 to 3 |
| Sum of the phases | 15 to 43 |
What does each phase have to produce before the next one starts?#
Each of the five phases ends on a deliverable rather than a date, and a phase that starts before that deliverable exists inherits its open questions. That is the useful way to read a phase plan, because a hand-off either exists or it does not.
- Discovery hands over the list of systems to connect, a sample of the old data and the decisions still open.
- Design hands over screens and a data model the build can work from without guessing.
- Build hands over working software in slices, not one large delivery at the end.
- Testing hands over evidence that the slices work together and with every outside system.
- Launch hands over a product that real users run, with a way back if something breaks.
The build is where the slices matter most. The Scrum Guide, last revised in November 2020, calls sprints "fixed length events of one month or less". So finished work arrives at least once a month. In practice that rhythm keeps a five-phase plan honest. When a hand-off is missing, it shows up within weeks instead of at the end.
Launch has its own clock too. The DORA metrics guide, updated in 2025, defines change lead time. It is the time a change takes to go from committed to version control to deployed in production. A team with a short lead time fixes launch problems in days. Meanwhile, a team with a long one can turn small launch issues into weeks.
The phases also overlap. Testing runs beside the later build slices, and migration work runs beside everything. That is why the drivers below map to single phases rather than to the whole plan.
How far do real projects drift from their own plan?#
Across three published studies of application and systems development projects, the mean schedule overrun sat between 22 and 23.4 percent of the original plan. The three studies sit in Table 1 of a paper in the Journal of Management Information Systems. Bent Flyvbjerg and colleagues published it on 26 August 2022. So a fifth or more over plan is the normal case, not the bad one.
These measured means sit below the 30 to 40% from the 2023 paper, and both can hold. The three means come from specific samples, as reported by managers in surveys and interviews. The 30 to 40% is a summary the 2023 paper takes from earlier reviews, not its own count. So read about a fifth as what these three samples measured, and 30 to 40% as the wider margin this guide plans with.
Show data table
| Item | Value |
|---|---|
| 89 internal application development projects, 89 firms | 23.4 |
| 32 application systems, 5 organizations | 22 |
| 72 systems development projects, 23 organizations | 22 |
All three studies put the mean overrun at a fifth or more of the original plan.
The mean also hides the shape. The same 2022 paper fitted the schedule overruns of 962 projects. It found that "effort and schedule overruns also follow a power-law distribution". In plain terms, most projects slip a little and a few slip by far more, which is why a schedule buffer sized from your own past releases beats one sized from the average. The paper also reports one study of 106 projects where the worst case was close to a 700% overrun.
Therefore an average is the wrong safety margin on its own. It tells you what usually happens, while the tail tells you what can happen. Since a large project with many unknowns lives closer to the tail, it needs the drivers scored. A percentage added at the end is not enough.
What does a mean ratio of 2.0 do to a six-month plan?#
In one company's 106 software development projects, actual duration averaged 2.0 times the estimate, which turns a six-month plan into a likely twelve months. The figure comes from a 2006 study by Todd Little in IEEE Software. The Journal of Management Information Systems review of 2022 sums it up: projects took twice as long as first estimated, on average. Doubling a plan sounds harsh, so treat 2.0 as the upper reference rather than a forecast.
Show data table
| Dimension | Planned months | At the 2.0 mean ratio |
|---|---|---|
| Planned 3 months | 3 | 6 |
| Planned 6 months | 6 | 12 |
| Planned 9 months | 9 | 18 |
At the mean ratio of 2.0, every plan length doubles.
Two cautions apply. First, the projects in the 2006 study came from a single company, and the review itself calls that a small sample. Second, the study's title is about the cone of uncertainty, the idea that early estimates carry the widest error. So read 2.0 as the cost of estimating before discovery has answered its questions, not as a law.
Here is the worked example the rest of this guide uses. Take a plan of six months with three systems to integrate and one legacy database to migrate. At the cited 30 to 40%, the likely finish is about eight months. At the 2.0 ratio, it is twelve. Where it lands depends on whether the integration and migration work starts in discovery or after the build.
Where in a delivery does the delay show up?#
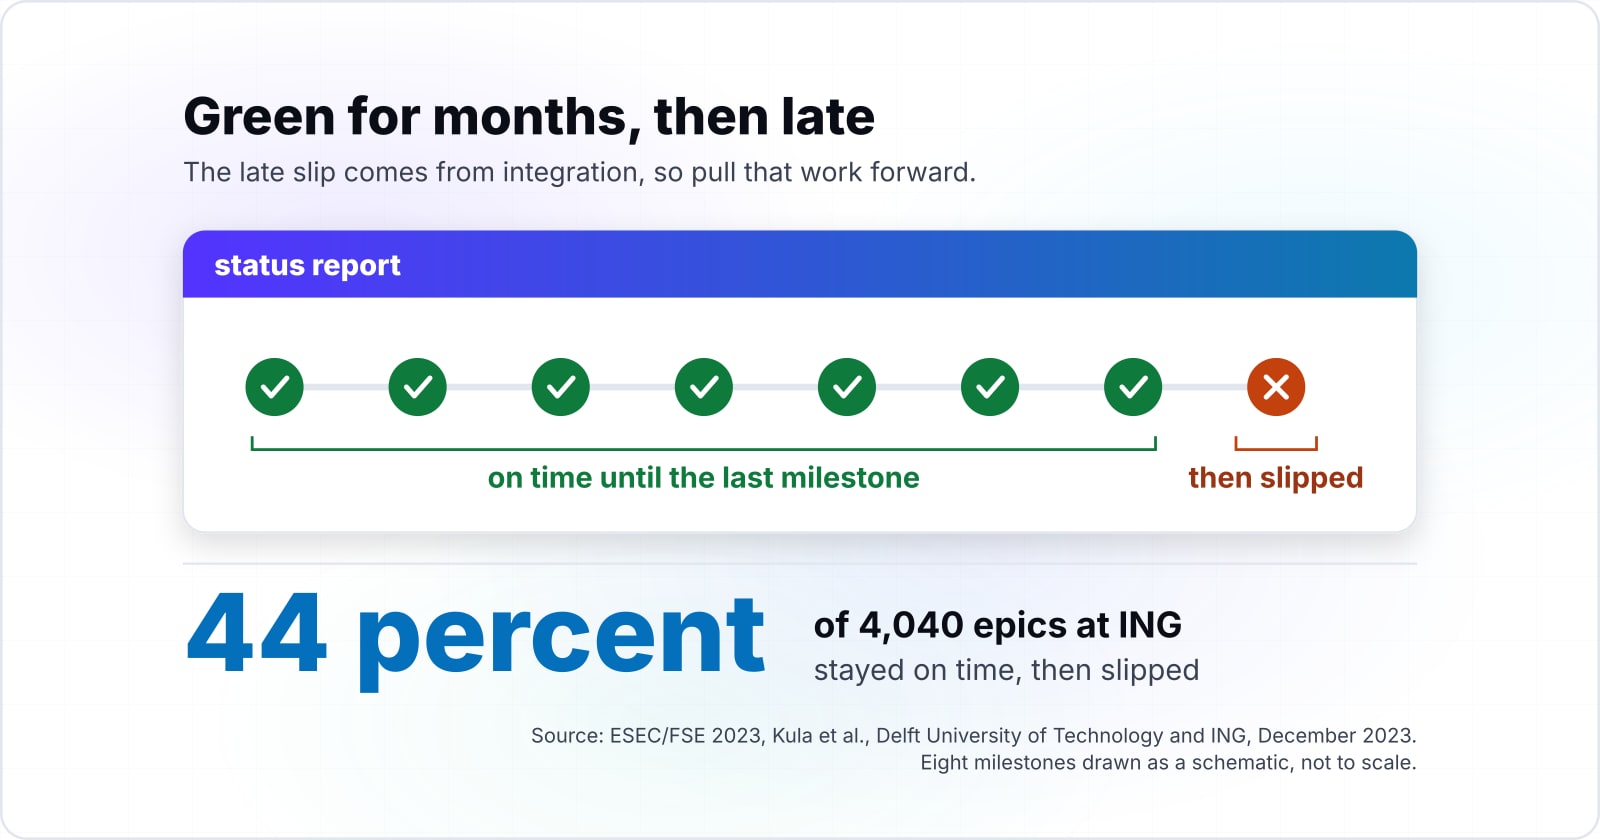
Of 4,040 epics at ING, 44 percent stayed on time until the last milestones and then slipped, so a late finish rarely announces itself early. In the 2023 study, an epic is a project built in short iterations. The researchers tracked 4,040 epics and 270 teams at ING. Most epics showed one of two shapes: quiet until the end, or troubled from the start.
Show data table
| Segment | Value | Share |
|---|---|---|
| Late only at the end | 44 | 44% |
| Early peak, late | 36 | 36% |
| Recovered | 14 | 14% |
| Alternating | 6 | 6% |
The largest group looked on time until the last milestones.
The late group is the one to plan for. According to the ESEC/FSE 2023 paper, those epics run into more incidents and unplanned work. That likely caused the delay at the end of the delivery. Meanwhile, the early-peak group had a significantly higher number of outgoing dependencies and a heavier developer workload.
As a result, a status report can look green for months and still end late. Since the late slip comes from integration, incidents and unplanned work, the fix is to pull that work forward. But watching the report more closely does not help, because the report measures the part that is going well.
Why does every system you integrate stretch build and testing?#
Each external system adds a contract to agree, a test environment to borrow and a failure to rehearse, and the slipping epics at ING carried more outgoing dependencies. Every one of those items sits outside your team's control, so each one moves at someone else's speed.
Each outside system brings its own owner, its own release cycle and its own test data. For example, a payment provider may hand over a test account within a day. But an internal system run by another department may need a request, a meeting and a change window first. The build can fake the other side for a while, but testing cannot, so the wait moves to the end. That is the late slip from the previous section, seen from the inside.
In practice, count the systems and mark the ones you do not control. Three integrations you own are a different risk from three you have to ask for. Then start each risky one in discovery with a single real call: one record read, one record written. If that call takes a month to arrange, you learn it in week two rather than in the testing phase.
| A system you own | A system you have to ask for | |
|---|---|---|
| Owner, release cycle and test data | Yours | Its own |
| Moves at | Your team's speed | Someone else's speed |
| Integration score | Low at one or two | High at any one |
| First step | Count it | Start it in discovery with a single real call |
Why does data migration run on its own clock?#
Data migration is paced by the state of the old data rather than by the build, so it starts in discovery with a sample extract or it finishes last. The mess in old data stays hidden until someone tries to move it.
Duplicate customers, free-text fields used as dates, codes whose meaning lives in one person's head: each one is found by running a load. Reading a schema does not find them. Therefore migration work is discovered, not estimated. When a plan gives it a fixed week near launch, it is guessing at work that has not been looked at yet.
The fix is simple and rarely done. Pull a real extract in the first weeks of discovery, load it into the new data model, and count what breaks. Then repeat the load every sprint, so the final cutover is a rehearsal you have already run several times. Because the old system keeps changing during the build, the last load also has to catch up on recent changes.
In the worked example, the one legacy database is the item most likely to pull the finish toward twelve months. If it starts after the build, its surprises land in testing. If it starts in discovery, they land in design, where the data model can still bend to fit them.
How much calendar time do waiting decisions add?#
A decision that waits a week adds a week to the calendar, because the build can only absorb the wait by guessing, and guesses come back as rework. No estimate counts this time, because an estimate measures work and a wait is not work.
Pravaah Consulting's guide says it plainly: a development team waiting a week for sign-off loses that week from the schedule every time. While the team waits, it has two bad options. It can stop, and the calendar slips by the length of the wait. Or it can guess, and a wrong guess comes back later as rework on top of the wait.
Decision latency is the one driver that sits on the side of the people paying for the software. That makes it the cheapest one to fix, since it needs a calendar and a named owner, not more budget.
Does adding people or cutting scope shorten a late project?#
Cutting scope shortens a late project, while adding people usually does not, because each new person needs time from the people already doing the work. Scope is the driver you can still move late, and team size is the one you set early.
Cutting scope works because it removes work outright. When a feature moves to a second release, its build, tests and integration leave the plan in one decision. Adding people works the other way at first. New people need context, access and code review from the existing team, so output often dips before it rises.
| Cutting scope | Adding people | |
|---|---|---|
| Effect at first | Removes work outright | Output often dips before it rises |
| Why | Its build, tests and integration leave the plan in one decision | New people need context, access and code review from the existing team |
| When it is decided | Can still be pulled in month five | When the team is formed, before the build starts |
The ING data points the same way. In the ESEC/FSE 2023 study, the epics that recovered after an early delay involved significantly smaller teams. The authors suggest that teams with fewer members may need some buildup time to respond to delay. In other words, a small team can recover, but it needs slack to do it, and that slack is decided when the team is formed.
In short, size the team before the build starts, for the integration and migration you scored. Then keep a ranked cut list ready for the day the date stops moving. Scope is the lever you can still pull in month five, while team size mostly is not.
How do you score your own project before the plan is signed?#
Score integration surface, data migration, decision latency, scope and team as low, medium or high, and every high score marks the phase that will stretch. The scores take about an hour and need nothing beyond the plan you already have.
- Integration surface. Low is one or two systems you own. High is three or more, or any system you do not control. A high score stretches build and testing.
- Data migration. Low is no legacy data. High is a legacy database with years of history. A high score stretches testing and launch.
- Decision latency. Low is one owner who answers within days. High is a committee or a sponsor who is rarely there. A high score stretches every phase, and design most of all.
- Scope. Low is a fixed, ranked list. High is a list that is still growing. A high score stretches the build.
- Team. Low is a team sized for the work before the build starts. High is a team still being hired, or a small team with no slack. A high score slows recovery from any slip.
Then read the score against your planned months. As a modelled rule of thumb, not a measured one, no high scores means the 30 to 40% figure cited in the 2023 study is a fair margin. With two or more highs, plan toward the 2.0 ratio. Also move the work behind each high score into discovery.
For instance, score the six-month example. Integration is high with three systems, and migration is high with one legacy database. The other three drivers are medium. That is two highs, so the honest plan reads eight to twelve months. It should also schedule a real integration call and a sample data load in the first month.
Your likely finish range
Enter your planned months and score each driver 1 for low, 2 for medium or 3 for high. The defaults are the six-month worked example above.
Likely finish, high end (up to 2.0 times the plan)
12 months
- Drivers scored high
- 2
- Likely finish, low end (30% over)
- 8 months
Arithmetic from your own scores, using ESEC/FSE 2023 and JMIS 2022. Modelled, not measured.
When is a phase-by-phase estimate the wrong tool?#
A phase-by-phase estimate is the wrong tool for a two-week prototype or a date fixed by a regulator; a timebox with an agreed cut list serves better there. Three cases call for something else.
First, a short prototype. Estimating five phases costs more than building it, so fix two weeks and see what fits. Second, a date set by a regulator or a contract. That date will not move, so fix the time, rank the scope and agree in advance what gets cut. Third, a product that will keep changing long after launch. There, plan in sprints of "fixed length events of one month or less", as the Scrum Guide puts it. Then forecast from work actually finished, not from a phase table.
In each case the advice is the same. When time is the fixed thing, let scope float and say so on the first day. The five drivers still matter, but they decide what goes on the cut list rather than when you finish.
Where do cost and delivery method fit into the same plan?#
Cost follows the same five drivers as the timeline, and the delivery method a team works in decides how often decisions get made. So the next question is usually one of those two, and this custom software development timeline shapes both.
Every driver that stretches the calendar also adds to the bill. The guide to custom software development cost walks the same ground in money. Also, the way a team works sets how often decisions happen. The comparison of software development methodologies lays those rhythms side by side. Once the plan is set, managing project timelines covers holding a committed date without cutting quality. If you are still choosing who will build it, read how to choose a custom software development company. It covers how to test an estimate in the first month.
If you want the drivers scored before anyone signs a plan, that is what a product discovery phase is for. And custom software development covers the build itself. Neither is needed to use the method above. Your planned months, the five drivers and an honest hour are enough to see which phase will stretch.