Computer vision in retail: which uses pay back, and why integration costs more than the cameras
Shelf alerts and queue counts earn their keep in ordinary stores. Checkout-free, the famous one, now lives mostly in small stores, and the reason is arithmetic you can check yourself.
What actually works in computer vision in retail?#
Computer vision in retail works where a missed detection costs little and feeds one task list, and stalls where every item must be right and must reach payment. So every use case on a vendor's list faces two tests. First, what does one wrong detection cost? Second, how many store systems must a right detection reach before it pays?
A shelf-gap alert passes both tests. When the camera misses one empty facing, the next pass catches it. Also, the alert only has to reach the restocking list. A queue count works the same way, because a count that is off by one changes nothing. Then its output goes to whoever opens a till. In short, these uses forgive error and touch one system.
Checkout-free fails both tests. Every item in the basket must be identified, because one wrong item is a wrong charge. Then the result must reach payment, the point of sale (POS) system and inventory at once. Amazon's own update, revised on 27 January 2026, opens with "Amazon is closing Amazon Go and Amazon Fresh physical stores". In particular, the same article explains why its large grocery stores had already moved to a cart. What follows is the money, the mechanism and the evidence, then three numbers a pilot should prove.
How much money is a retail camera project actually chasing?#
Retailers in the NRF's 2023 survey lost 1.6 percent of sales to shrink, $112.1 billion, up from 1.4 percent and $93.9 billion a year earlier. Shrink is stock that leaves the store unpaid, through theft, error or damage. The National Retail Federation published these figures in its National Retail Security Survey on 26 September 2023.
$93.9 billion
Fiscal 2021, 1.4 percent of sales
$112.1 billion
Fiscal 2022, 1.6 percent of sales
Shrink rose in both share and dollars between fiscal 2021 and 2022.
| Option | billions of US dollars of shrink |
|---|---|
| Fiscal 2021, 1.4 percent of sales | $93.9 billion |
| Fiscal 2022, 1.6 percent of sales | $112.1 billion |
Source: National Retail Federation, National Retail Security Survey, 26 September 2023
However, empty shelves cost more than theft does. Gruen and Corsten wrote a 2007 report for three US grocery industry groups (GMA, FMI and NACDS). In it they restate that "retailers on average lose 4 percent of their annual sales due to OOS items", meaning out-of-stocks. So a shelf camera chases a loss of a few percent of sales, not a fortune.
For example, say a store has 20 million US dollars of annual sales. In that worked example, about 800,000 dollars a year walks out as missed sales at 4 percent. In the same worked example, shrink at the NRF's 1.6 percent adds about 320,000 dollars more. Therefore a camera project there must win back a share of those two figures, after its own running costs.
What empty shelves and shrink cost your store
Enter your store's annual sales; it applies the 4 percent out-of-stock loss and 75 percent store-practice share from Gruen and Corsten, and the NRF's 1.6 percent shrink.
Yearly out-of-stock loss at 4 percent of sales
$800,000
- Share of it that starts in store practice, at 75 percent
- $600,000
- Yearly shrink at 1.6 percent of sales
- $320,000
Illustrative, modelled not measured; rates from Gruen and Corsten (2007) and the NRF (26 September 2023).
Why do shelf cameras pay back only when the alert reaches a person?#
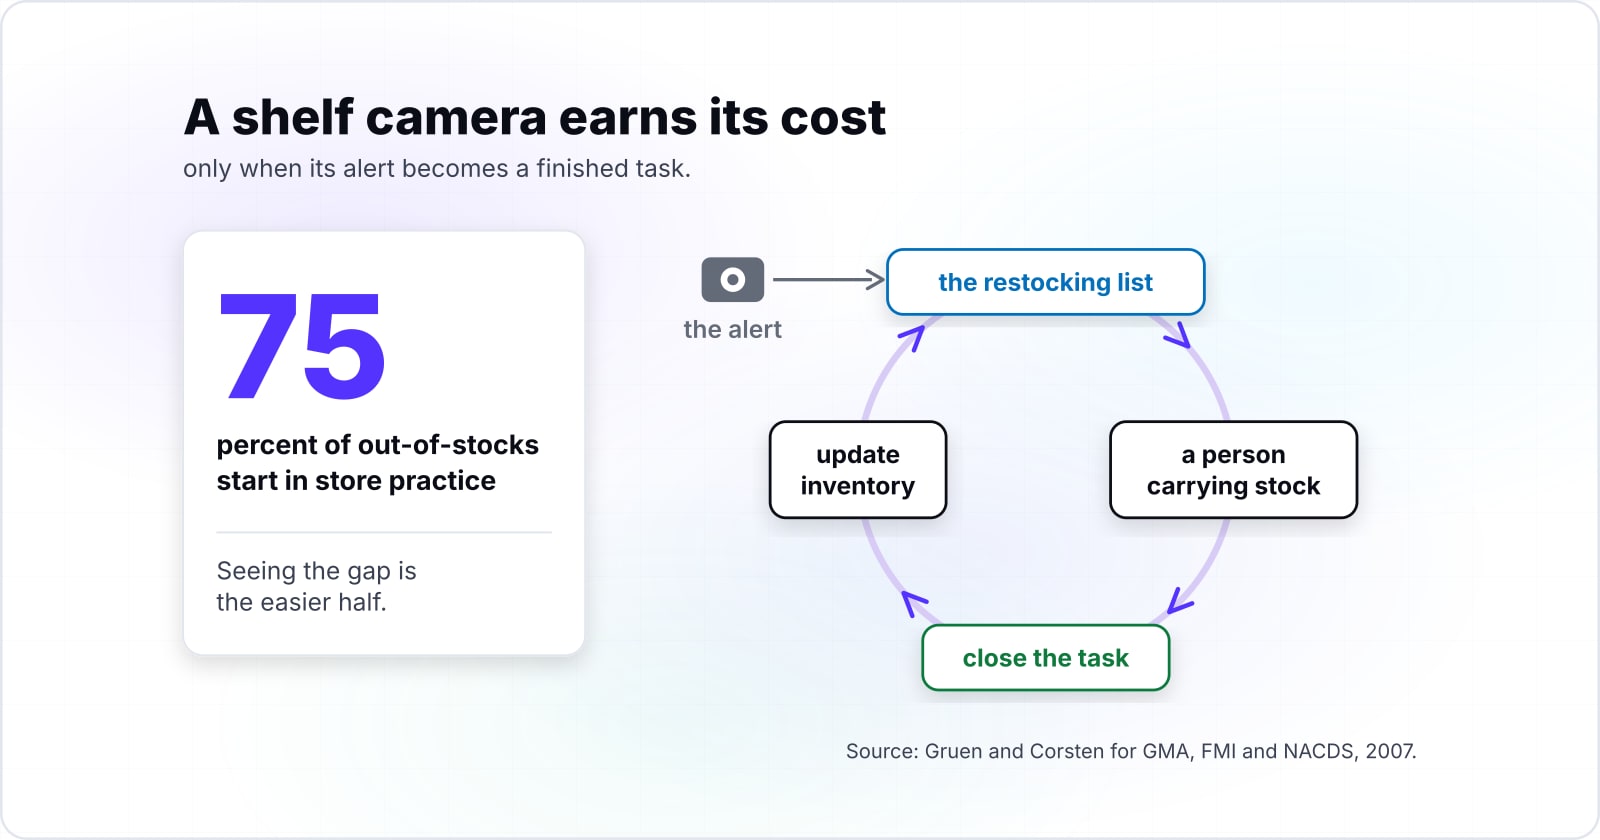
Gruen and Corsten found that 75 percent of out-of-stocks start in store practice, so a shelf camera earns its cost only when its alert becomes a finished task. Their 2007 report says "75 percent of the cause was due to retail store practices (opposed to up-stream supply issues)". In practice, most gaps come from ordering, shelf filling and stock left in the back room.
Show data table
| Segment | Value (percent of out-of-stock causes) | Share |
|---|---|---|
| Retail store practices | 75 | 75% |
| Upstream supply issues | 25 | 25% |
Three in four out-of-stocks start inside the store, so the fix is a person, not a supplier.
Seeing the gap is the easier half. Goldman and colleagues built the SKU-110K shelf photo set, released on 1 April 2019, with well over a hundred products packed into each photo. They call precise detection in such packed scenes "a challenging frontier". However, a shelf count does not need perfection, because a missed facing is caught on the next pass.
The hard half is what happens after the alert. Because most gaps start in the store, the fix is a person carrying stock from the back room. So the alert must land in the restocking list that staff already use, with the aisle, shelf and product named. Then someone must close the task, and the closed task must update inventory. Without that loop, a shelf camera makes an accurate list of problems that stay unfixed. In the worked example above, the loop is worth up to 600,000 dollars a year; the camera alone is worth none of it.
Why does a model that reads a shelf well fail a whole basket?#
On the RPC checkout dataset, the best method got the whole basket right 73.17 percent of the time with light clutter and 42.48 percent with heavy clutter. Checkout accuracy is the product of every item being right, so it falls as baskets grow. Wei, Cui, Yang, Wang and Liu published the dataset on arXiv on 22 January 2019. It holds 200 product types photographed on a checkout counter.
The authors scored a basket as passing "if and only if the complete product list is accurately predicted". With 3 to 10 items, the best method passed 73.17 percent of baskets in 2019. Then with 10 to 15 items it passed 54.69 percent, and with 15 to 20 items only 42.48 percent.
Show data table
| Item | Value |
|---|---|
| Easy clutter | 73.17 |
| Medium clutter | 54.69 |
| Hard clutter | 42.48 |
Only 42.48 percent of the largest baskets came out exactly right, against 73.17 percent of the smallest.
Meanwhile, the same 2019 paper reports a standard per-item detection score between 96.45% and 97.34% at every basket size. That gap is the whole story. Each item is found well, but a basket is only right when every item is right, so small errors multiply.
For example, say each item is right 99 times in 100. In that worked example, a five-item basket is fully right about 95 percent of the time. With fifteen items, the same worked example drops to about 86 percent. While a shelf count can live with that, a till cannot, because each failure is a wrong charge to a real customer.
What did Amazon's own stores show about checkout-free?#
Amazon kept Just Walk Out for small stores with quick, few-item trips, moved large grocery stores to Dash Cart, and in January 2026 began closing Amazon Go and Amazon Fresh. Its own Just Walk Out site says the system "uses computer vision, weight sensors, and deep learning models to identify the items". In short, even the flagship does not rely on cameras alone.
Amazon's article on Just Walk Out and Dash Cart explains the split in plain terms. Shoppers in small stores are "making quick purchases of relatively few items". However, in larger grocery stores, "where customers are making a big weekly trip and buy a greater number of items", they "so far prefer Amazon Dash Cart". With Dash Cart, shoppers sign in and start "scanning, and weighing items as they go". Then the update of 27 January 2026 added the closures, with some stores turning into Whole Foods Market stores.
That is the RPC curve playing out in real aisles. Where baskets are small, checkout-free works and sells well. For instance, Amazon reports an 85% increase in transactions per game at Lumen Field in Seattle after its first Just Walk Out store opened. Also, the Just Walk Out FAQ lists stadiums, venue concessions and event merchandise shops. It offers store kits that are "faster to deploy". Where baskets are big, though, the company that built the system chose a cart where the shopper does part of the identifying. That is a design choice worth copying, not a failure to hide.
| Trip | Design Amazon uses | What identifies the items |
|---|---|---|
| Small store, quick trip with few items | Just Walk Out | Computer vision, weight sensors and deep learning models |
| Large grocery store, big weekly trip | Dash Cart | The shopper scans and weighs items as they go |
| Apparel | RFID lanes | RFID readers at the exit gate read the tags in the clothing |
Which retail losses can a camera actually see?#
In the NRF's 2023 survey, external theft was 36 percent of shrink, internal theft 29 percent and process failures 27 percent, and each needs a different camera and workflow. The survey says external theft "accounted for an average of 36% of total loss". Meanwhile, unknown causes made up 6 percent and other causes 1 percent.
Show data table
| Item | Value |
|---|---|
| External theft | 36 |
| Internal theft | 29 |
| Process, control failures and errors | 27 |
| Unknown | 6 |
| Other | 1 |
External theft is the largest source at 36 percent, with internal theft and process failures close behind.
Each source is seen in a different place. External theft happens on the shop floor and at the exits. So the camera watches aisles and doors, and store security acts on it. Internal theft happens at tills, in stock rooms and at the receiving dock. There the camera watches those spaces, and a loss team acts later. Finally, process failures are wrong counts, wrong labels and damaged stock. Those show up in receiving and in the stock records more than on any video.
| Source of shrink | Share of shrink | Where it shows up, and who acts |
|---|---|---|
| External theft | 36 percent | The shop floor and the exits; store security acts |
| Internal theft | 29 percent | Tills, stock rooms and the receiving dock; a loss team acts later |
| Process failures | 27 percent | Receiving and the stock records, more than on any video |
As a result, one camera pointed at all of shrink fails. A project should name one source, one place to watch and one team that acts. Then it can be measured against that slice of the loss, not against the whole 1.6 percent.
What does a loss-prevention camera cost when it is wrong?#
The FTC found Rite Aid's facial recognition produced thousands of false-positive matches between 2012 and 2020, and banned the retailer from using it for five years. The US Federal Trade Commission announced the order on 19 December 2023. Its release states, "The system generated thousands of false-positive matches."
The cost of a wrong match lands on a person. According to the US Federal Trade Commission, customers were "erroneously accused by employees of wrongdoing" after false matches. The release also lists what was missing. First, Rite Aid did not test the system's accuracy before use. Second, it did not track the rate of false matches after rollout. Finally, it did not train staff to expect wrong matches.
Every one of those gaps is a process gap, not a camera gap. Because staff act on every alert they get, a false alert is never free. Therefore a loss camera needs a measured false-alert rate and a review step before anyone approaches a customer. Also, cameras that see faces carry privacy duties that a shelf camera never does, so privacy design comes before go-live.
Why does the integration cost more than the cameras?#
Recognition is a small line in a retail vision budget, priced per thousand units, so the catalogue, the store events and the staff tasks around it are the bill. Google's Cloud Vision pricing page, read on 1 October 2026, counts each feature applied to an image as a unit. It lists label detection as free for the first 1000 units a month. Above that, the price for each further block of 1000 units is $1.50.
Show data table
| Item | Value |
|---|---|
| Units 1001 - 5,000,000 / month | 1.5 |
| Units 5,000,001 and higher / month | 1 |
Past the free first 1000 units, label detection costs $1.50 per 1000 units, and $1.00 above 5,000,000 a month.
Instead, the money goes to four places. First comes the catalogue. Google's Vision API Product Search docs say retailers "create products, each containing reference images that visually describe the product from a set of viewpoints". As a result, every new product and pack design needs those images before a camera can name it.
Second come the store events. A recognised product means nothing until it becomes a POS line, a stock change or a label check. Third comes the task flow, the screen or handheld where staff see the alert and close it. In practice, that loop is integration work across POS and inventory, not model work.
Fourth comes the exit plan. Microsoft's migration guide says the Image Analysis API "will be retired on September 25, 2028". So a project built on one vendor's service needs a budget to move when that service ends.
What should a pilot prove before a store chain scales it?#
A pilot should prove three numbers before scale: the false-alert rate staff will tolerate, the share of alerts that become finished tasks, and the recovered sales against the loss. A demo that names products on a shelf only proves the camera can see.
The first number is the false-alert rate, measured in the store over weeks. The Rite Aid order shows what happens when it goes untracked. So set the rate staff will accept before the pilot starts, then count every alert that turns out wrong. The evaluation set and pass bar behind that rate are the model side of a pilot, and AI model evaluation sets them.
The second number is alert-to-task completion. Because three in four gaps start in store practice, the alert is only worth something once a person restocks the shelf. So count how many alerts became closed tasks, and how long each took.
The third number is recovered sales. Compare pilot stores with similar stores that have no cameras, over the same weeks. Then set the gain against the store's own loss from the calculator above. For instance, say a store with 800,000 dollars of out-of-stock loss wins back a tenth of it. That example earns 80,000 dollars a year, which has to cover cameras, recognition, catalogue work and staff time.
- Number 1
The false-alert rate
Measured in the store over weeks, against a rate staff agreed to accept before the pilot started. The FTC order of 19 December 2023 shows what happens when it goes untracked.
- Number 2
Alert-to-task completion
How many alerts became closed tasks, and how long each took. Three in four gaps start in store practice (Gruen and Corsten, 2007), so an alert is worth something only once a person acts.
- Number 3
Recovered sales
Pilot stores against similar stores with no cameras over the same weeks, set against the store's own loss from the calculator above.
If any of the three numbers is missing, the pilot has not answered the question. In short, scale on the numbers, never on the demo.
When is a camera the wrong tool for the job?#
When a barcode, an RFID tag or a scan-as-you-go cart already answers the question, a camera adds cost and error without adding an answer. The rule is simple. If the item can identify itself, let it.
Amazon follows that rule in its own stores. For apparel, for instance, its Just Walk Out FAQ describes RFID lanes, where "the RFID tags in the clothing and other apparel is read by RFID readers" at the exit gate. For large grocery trips, it moved shoppers to Dash Cart, where the shopper scans and weighs items as they go. As a result, both choices take the hardest part of the job away from the camera.
So three cases point away from vision. First, if stock counts are the goal and items carry tags, an RFID read is more direct than a camera count. Second, if checkout is the goal and baskets are large, a scanning cart or a self-checkout lane is cheaper to make right. Third, if the store's stock records are wrong, fix receiving and counting first, because a camera will only report gaps the records already hide. In each case, the simpler tool wins.
| Goal | When | The simpler tool |
|---|---|---|
| Stock counts | Items carry tags | An RFID read |
| Checkout | Baskets are large | A scanning cart or a self-checkout lane |
| Accurate gap reports | The stock records are wrong | Fix receiving and counting first |
Where should a retail vision project go next?#
Start from the store system the detection must reach, POS, inventory or the task list, and choose the camera use case that system can act on. That order keeps the project tied to the money from the start.
When the detection must reach the till, read how cloud POS systems handle retail data before choosing a camera. When it must reach stock and reordering, how supply chain management software tracks inventory covers the records a shelf alert has to update. The same pick-the-one-that-pays-first method applies on a factory floor, as AI software in manufacturing shows.
Where a vendor's product stops at the alert, the missing piece is the store-side workflow, which is custom software built around the task list. Even so, the sources linked above, from the NRF survey to the RPC paper, are enough on their own to size computer vision in retail for one store and set a pilot's three numbers.