AI software for manufacturing: the main AI applications in manufacturing, real examples and the build that pays first
Most factories are offered a long list of things AI can do and no way to rank them. The ranking is already on your own books, in where the money leaks, and it points to one build before the rest.
What does AI software for manufacturing actually change on the line?#
AI software for manufacturing pays when it targets your biggest loss first, and in NIST's survey of 2016 costs, lost sales from delays and defects dwarfed downtime. That is the finding most vendor lists skip. Yet it changes which project you fund.
NIST's machinery maintenance page, updated 23 September 2026, reports the survey behind report AMS 100-34. It puts 2016 losses from preventable maintenance issues at $119.1 billion, of which $0.8 billion was defects and $18.1 billion was idle equipment.
Show data table
| Item | Value |
|---|---|
| Lost sales from delays and defects | 100.2 billion US dollars |
| Downtime | 18.1 billion US dollars |
| Defects | 0.8 billion US dollars |
The sales never made cost more than five times the stopped machines.
So the value of an AI project is not set by the model. Instead, it is set by two plain things. First, which loss the model is pointed at. Second, whether its answer can reach the line and change what happens there.
In practice, the usual projects each attack a different loss. Predictive maintenance goes after failures, and vision inspection goes after defects that escape. Production planning goes after late orders, and energy optimisation goes after the power bill. Also, each one needs its own data and a place to land its answer. The next section shows each of them working at a named site, and the rest turns that into a ranking you can run.
What are the main applications of AI in manufacturing?#
The main AI applications in manufacturing are predictive maintenance, vision inspection, production planning, energy optimisation and parameter tuning; in January 2026 the World Economic Forum reported 99.8% inspection accuracy at Eaton's Changzhou plant. Each one attacks a different kind of loss. The sites in the WEF's Global Lighthouse Network show what each delivered once it was live.
Here are five examples of AI in manufacturing, each with the result its site reported to the WEF.
| Site | AI application | Reported result |
|---|---|---|
| Eaton, Changzhou, China | Camera-guided robot torso that inspects control-box wiring | Inspection accuracy of 99.8% |
| Haier, Shanghai, China | Welding programming agent that learns from its own runs | Robot programming time cut from 16 hours to 1 hour |
| SOCAR Carbamide, Sumqayit, Azerbaijan | Machine-learning energy optimisation on a no-code platform | Energy consumption down 18% |
| China Resources Building Materials, Tianyang cement site, China | More than 30 use cases, advanced analytics among them | Unplanned downtime down 56% |
| Siemens, Chengdu, China | Predictive maintenance, AI waste sorting and energy management | Unit product energy down 24%, production waste down 48% |
Source: World Economic Forum, Global Lighthouse Network white papers of January 2026 (Eaton, Haier, SOCAR Carbamide) and December 2023 (Tianyang, Siemens).
Start with Haier, because its gain is time, not quality. In the WEF's January 2026 white paper, its Shanghai works runs a self-adaptive welding programming agent. It uses reinforcement learning to find and recommend changes to its own programming, which cut programming time from 16 hours to 1 hour. That is parameter tuning, the least talked-about entry on the list.
Next, SOCAR Carbamide in Sumqayit shows the energy case. The WEF's January 2026 paper says machine-learning optimisation of power and steam, built on a no-code platform, cut its energy use by 18%. Then Tianyang, a cement site run by China Resources Building Materials, shows scale. The WEF's December 2023 paper on AI at scale says it ran more than 30 use cases and cut unscheduled stops by 56%.
Eaton and Siemens round out the set. In the World Economic Forum's January 2026 paper, the Changzhou site faced 30,000 wires to check each day, and a camera-guided torso on a mobile robot "improved inspection accuracy to nearly 100%". In the WEF's December 2023 paper, Siemens's Chengdu factory "implemented predictive maintenance throughout the manufacturing process", with AI waste sorting beside it, and cut unit energy by 24% and waste by 48%.
AI is now built into most of what these sites deploy, and generative AI is the fastest riser.
Show data table
| Item | Value |
|---|---|
| Analytical AI and machine learning | 62 percent |
| Generative AI (share of top-five solutions) | 23 percent |
| AI agents | 5 percent |
Analytical AI is already in most Lighthouse solutions, and generative AI is the fastest riser.
Read those results with care, though. The WEF picks leading sites, so the figures show what is possible, not what is typical. In particular, several results come from a bundle of changes, not from one model. Still, the pattern holds across all five. Each team aimed its AI at one named loss, whether defects, setup time, energy or stops. That is the rule the rest of this guide turns into a method.
Where does a plant's maintenance money actually go?#
NIST estimated 57.3 billion dollars of machinery maintenance spend in 2016, plus 16.3 billion more on faults and failures, and 45.7% of maintenance was reactive. That reactive share is the pool predictive software can shift. After all, it is work done after something has already broken.
NIST's page, updated 23 September 2026, adds $0.9 billion for buffer inventory, which brings the total to $74.5 billion. It defines reactive work as "maintenance done, typically, after equipment has failed or stopped". By contrast, predictive work starts from "predictions of failure made using observed data such as temperature, noise, and vibration".
Show data table
| Segment | Value (billion US dollars) | Share |
|---|---|---|
| Routine maintenance | 57.3 | 76.9% |
| Faults and failures | 16.3 | 21.9% |
| Buffer inventory | 0.9 | 1.2% |
Routine spend was the largest part, and faults and failures added $16.3 billion on top of it.
Those are 2016 national figures for discrete manufacturing, NAICS 321-339, excluding 324 and 325, so your own split will differ. NIST also notes published estimates that put maintenance between 15% and 70% of the cost of goods produced. However, the shape is the useful part. Nearly half of the work is done in a hurry, after a failure, and the budget line only shows what the repair cost.
What does relying on reactive maintenance cost a plant?#
In NIST's 2016 survey, plants in the top quarter for reactive maintenance had 3.3 times the downtime and 16.0 times the defects of the least reactive quarter. In other words, running machines to failure hits quality and orders far harder than the stopped hours everyone counts.
NIST's full comparison, on the page updated 23 September 2026, goes further. The most reactive quarter had 2.8 times the lost sales from defects, 2.4 times those from delays and 4.9 times the inventory increases caused by maintenance issues. The survey's authors draw the conclusion themselves: "reactive maintenance reduces quality and increases uncertainty in production time."
Show data table
| Item | Value |
|---|---|
| Defects | 16 times the least reactive quarter |
| Inventory increases | 4.9 times the least reactive quarter |
| Downtime | 3.3 times the least reactive quarter |
| Lost sales from defects | 2.8 times the least reactive quarter |
| Lost sales from delays | 2.4 times the least reactive quarter |
Running machines to failure hits quality and orders far harder than the stopped hours everyone counts.
As a result, a maintenance project is also a quality project. Take a bearing that runs hot for a week before it seizes, which does more than stop the line. It also turns out parts that drift out of tolerance, and some of them reach a customer. Because of that, a team that counts maintenance only in lost hours undercounts what it is losing.
However, these are associations, not proof of cause. For example, the same survey found that less reactive firms were more likely to make to order. They also tended to compete on reputation rather than on cost. Still, every one of these measures points the same way, and your own records will probably show it too.
Which AI use case should you build first?#
Build first for the loss that is largest on your own books: in NIST's 2016 survey, predictive leaders had an 87 percent lower defect rate but only 15 percent less downtime. So a predictive maintenance project sold only on stopped hours is sold on its smallest effect.
NIST's comparison, on the page updated 23 September 2026, covers firms that were less than half reactive. Within that group, the top half in predictive maintenance also had 66% less inventory increase from unscheduled repairs than the bottom half.
87% lower
Defect rate
66% less
Inventory increase from unscheduled repairs
15% less
Downtime
A predictive maintenance project sold only on stopped hours is sold on its smallest effect.
Show data table
| Option | percent below the bottom half |
|---|---|
| Defect rate | 87% lower |
| Inventory increase from unscheduled repairs | 66% less |
| Downtime | 15% less |
Source: NIST, Manufacturing Machinery Maintenance (NIST AMS 100-34), page updated 23 September 2026
Then match the use case to your largest loss. Here is the plain mapping.
- Breakdowns are the biggest line. Build predictive maintenance, a model that reads condition signals and flags a failure early.
- Scrap, rework or returns are the biggest line. Build vision inspection first. Or aim predictive maintenance at the machines whose wear causes the defects.
- Late orders are the biggest line. Build production planning, a model that reschedules around stops, changeovers and shortages.
- Energy is a large share of cost. Build energy optimisation, but only where power is a major input.
However, the energy case has the narrowest fit. The International Energy Agency's report on energy and AI, read in September 2026, makes the case for heavy industry. It says AI-enabled optimisation of production "could reduce energy costs by 3-10 percentage points in energy-intensive industries". So that is a strong case for a foundry or a glassworks. For an assembly line where power is a small cost, the same work moves little.
How many hours could predictive maintenance give back?#
Say a plant loses 400 hours a year to unplanned stops: a 15 percent gap in downtime is 60 hours, before counting the defects that ride along. The arithmetic is simple enough to do on your own number.
The 15% comes from NIST's figures for predictive leaders, on the page updated 23 September 2026.
So in this worked example, 400 hours times 0.15 gives 60 hours. For example, at 200 hours lost to stops the same gap is 30 hours, and at 800 hours it is 120.
Hours your plant could get back
Put in your plant's annual hours lost to breakdowns; it applies the 15% gap NIST recorded between the top and bottom halves in predictive maintenance.
Hours a year at the 15% gap
60 h
A worked example of an association across many firms, not a forecast for yours.
Be honest with the result, though. NIST's 15% is an association across many firms, not a promise for yours. It compares sites that already ran mostly planned maintenance, so a team that is mostly reactive starts further back. Also, hours are the smaller prize, since in the 2016 survey the same leaders showed an 87% lower defect rate.
So use the hours as a floor for the business case, not the ceiling. Next, value one hour of your line at its margin, not its running cost. Finally, add the defect and late-order effects from your own records.
What data does each use case need, and where does it come from?#
Every use case starts from machine data with context attached, and OPC UA's information modelling is what turns a raw tag into something a model can use. Without that context, a model sees a stream of numbers and cannot tell which machine, part or state they belong to.
Each use case needs its own inputs.
- Predictive maintenance needs condition signals such as temperature, noise and vibration. It also needs a failure history that says when each machine broke.
- Vision inspection needs labelled images of good parts and bad parts. They must be taken under the light and angle the line camera will use.
- Production planning needs orders, routings, machine capacity and the real stop history, not the planned one.
- Energy optimisation needs metered power by line or machine, next to the schedule it served.
| Use case | Loss it goes after | Data it needs |
|---|---|---|
| Predictive maintenance | Failures | Condition signals such as temperature, noise and vibration, plus a failure history |
| Vision inspection | Defects that escape | Labelled images of good and bad parts, under the line camera's light and angle |
| Production planning | Late orders | Orders, routings, machine capacity and the real stop history |
| Energy optimisation | The power bill | Metered power by line or machine, next to the schedule it served |
In practice, the machine half is where most teams find gaps. The OPC Foundation's OPC UA overview describes OPC UA, released in 2008, as "a platform independent service-oriented architecture". Its key line for AI work is short: "The OPC UA information modeling framework turns data into information." That model tells software a value is a spindle temperature on a named machine, not a bare register number.
Take the edge layer as one example. Microsoft's Azure IoT Operations overview describes how to "Connect an OPC UA asset to the Azure IoT Operations MQTT broker at the edge." Other stacks do the same job. However, the test is the same on any of them. Can you name the machine, the signal and its unit for every input the model needs? If not, that gap is the first piece of work.
Where does the model's answer land: MES or ERP?#
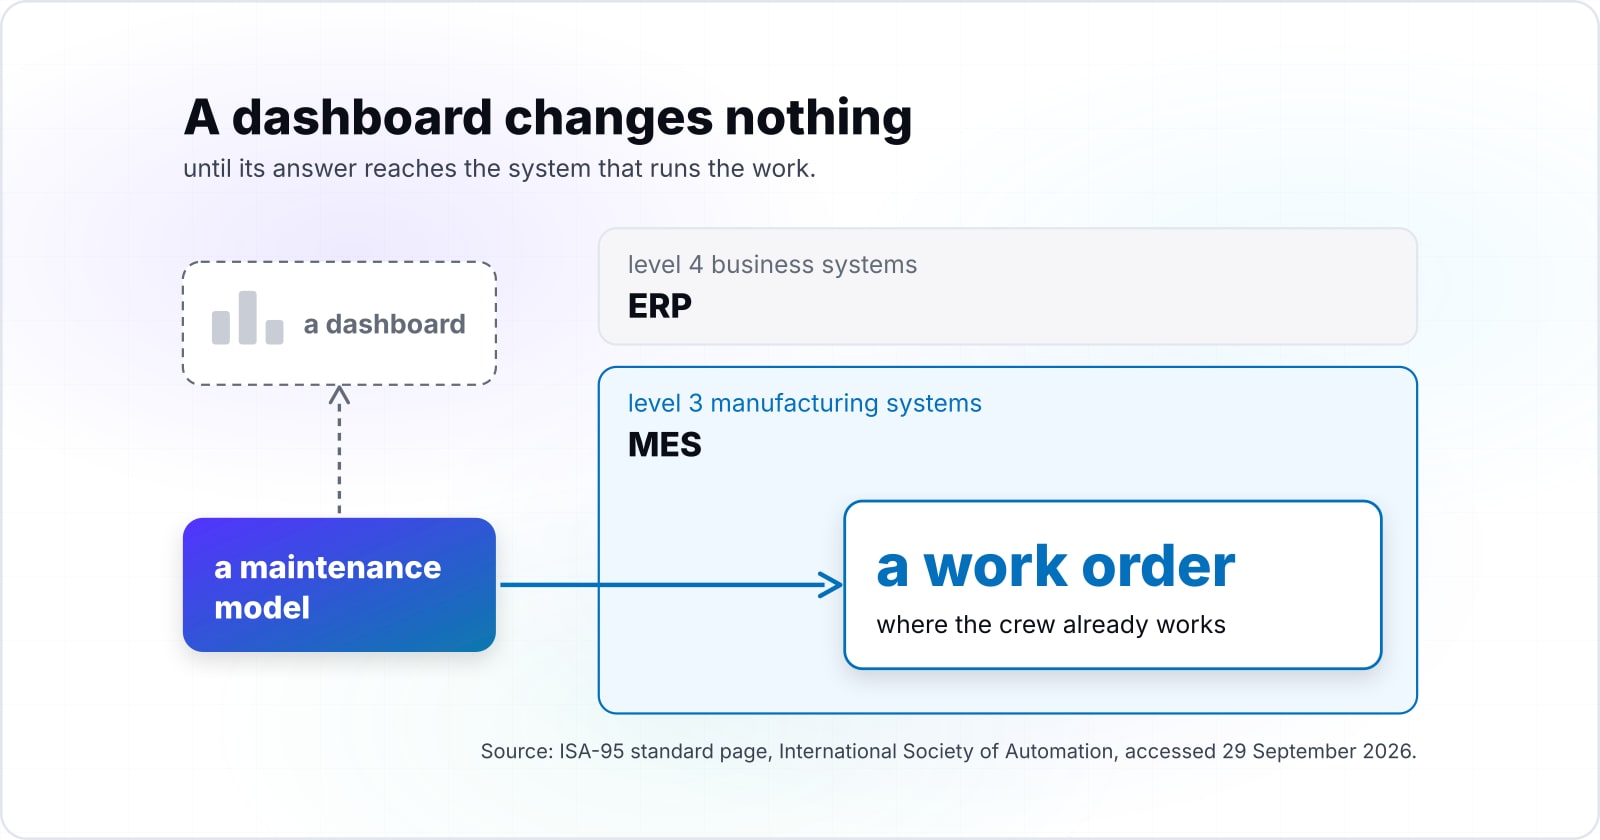
ISA-95 draws the line that matters here, the interface between level 3 manufacturing systems and level 4 business systems, and most stalled pilots never crossed it. A model that only draws a dashboard changes nothing until its answer reaches the system that runs the work.
The International Society of Automation's ISA-95 page says level 3 "describes manufacturing execution systems (MES) and other systems", SCADA among them. The ERP sits one layer up, in business planning and logistics. For Part 2, ISA puts the boundary in one sentence: "The interface considered is between level 3 manufacturing systems and level 4 business systems."
So each use case needs a write-back target. For example, a maintenance model should open a work order where the crew already works. Then a vision model should put a part or a batch on hold in the MES. Finally, a planning model has to change the schedule the MES runs and the ERP promises to customers.
This is where pilots stall. The model works in a notebook, but the connection that lets it act has no owner. The institute's AI for Manufacturing project, updated 17 July 2026, treats this as something to measure. It plans metrics for "System integration effort, performance, and semantic correctness" and a benchmark of integration on an MES use case. Therefore, budget the write-back as part of the build, not as a later phase.
How do you know the software is paying back?#
Measure payback on the numbers your plant already reports, such as downtime hours, defect rate and on-time orders, with a baseline taken before the model goes live. Then judge the software on the one number tied to the loss it was built to attack.
However, model accuracy is not that number. A failure model can score well in testing and still save nothing if the crew ignores its alerts. Instead, pick the shop-floor number that matches the loss. Use lost hours for a maintenance model and scrap rate for vision. Use on-time delivery for planning and energy per unit made for energy work.
ISO 22400 is a useful frame for defining those numbers well. ISO's page for ISO 22400-1:2014 says the standard was confirmed as current in 2025. It describes "an industry-neutral framework for defining, composing, exchanging, and using key performance indicators (KPIs)". As a result, your team, the software and any partner count the same way when they use its terms.
Three habits keep the measure honest. First, take at least one full production cycle as the baseline, so seasonal swings do not look like a result. Second, keep a line or a shift without the model for comparison, where you can. Third, track late and lost orders too, even when the project was sold on stopped hours, because lost sales were the largest loss in the 2016 survey.
Take at least one full production cycle as the baseline.
So seasonal swings do not look like a result.
Keep a line or a shift without the model for comparison.
Where you can.
Track late and lost orders too.
Even when the project was sold on stopped hours, because lost sales were the largest loss in the 2016 survey.
When is custom AI software the wrong tool?#
If your loss is a common one, such as bearing wear on standard motors or surface defects a vision product already detects, buy the platform and skip the custom build. Custom AI software earns its place only for the site-specific logic or connection a product cannot reach.
Here are three cases where custom is the wrong tool, and what to use instead.
- The loss is common and a product covers it. Standard motors, pumps and fans fail in well-known ways. So a packaged condition monitoring product will usually get there faster. Custom work, if any, is the connector that lands its alerts in your MES.
- The data does not exist yet. With no failure history and no labelled images, no model can learn. Instead, spend the first months on sensors, an edge data layer and clean records, and then decide.
- The model itself is standard. Training and hosting do not need to be built from scratch. AWS calls Amazon SageMaker AI "a fully managed machine learning (ML) service". It lets teams "build, train, and deploy ML models into a production-ready hosted environment." So build on a managed service like that, and put the custom effort into your data and your write-back.
| Case | Better option | Custom work left |
|---|---|---|
| The loss is common and a product covers it | A packaged condition monitoring product | The connector that lands its alerts in your MES |
| The data does not exist yet | Sensors, an edge data layer and clean records first | Decide once the data exists |
| The model itself is standard | A managed service such as Amazon SageMaker AI | Your data and your write-back |
In practice, the ISA-95 test settles most of these calls. Can a product's output cross into your level 3 and level 4 systems through an interface it already supports? If so, buy it. If not, the custom part is that interface, which is usually a smaller job than a custom model.
Where should you go from here?#
Start with the loss split on your own books, then read on for the ERP side of the boundary, the buy-or-build decision and the wider modernisation roadmap. After all, your maintenance log and your order history already hold most of the answer.
For the wider plan that AI fits into, see the digital transformation guide for manufacturing. For the business systems on the level 4 side, read supply chain management software. And for buying versus building in general, read custom software vs off-the-shelf software.
Perhaps the gap you found is the connection between machines, MES and ERP. If so, the API integrations page covers that work. If the ERP itself cannot take a model's output, the ERP development page covers that side. Yet none of that is needed for the first step. The maintenance survey page and the ISA-95 overview are free to read. On their own, they are enough to rank your losses and draw your data path this week.