JavaScript clean code practices, from naming to the event loop, with measured costs and the ESLint rules that hold them
Clean code sounds like a matter of taste until a promise resolves in the wrong order or a stale response overwrites a fresh one. Predictable code is the real goal, and most of it can be checked by a tool.
Which JavaScript clean code practices actually prevent bugs?#
The JavaScript clean code practices worth enforcing are the ones a study of 1807 releases tied to faults, plus predictable async code: ordered, cancellable, race-free and side-effect aware. That study is A large-scale empirical study of code smells in JavaScript projects, published in the Software Quality Journal on 22 March 2019. It looked for 12 types of code smell in 15 popular apps, including express, vue, webpack and moment.
| Item | count in the study |
|---|---|
| JavaScript applications studied | 15 |
| releases analysed | 1807 |
| code smell types detected | 12 |
Of those twelve, three smells stood out. The authors write that "Variable Re-assign," "Assignment In Conditional statements," and "Complex Code" have the highest fault hazard rates. In plain terms, that is a variable that keeps getting new values, an = inside an if test, and a function with too many branches.
However, the study looked at code as text. So it could not see the bugs that live in timing. Yet those are the ones that keep a team up at night: a test that fails one run in fifty, a search box that shows results for the wrong word, a page that freezes while a list loads. But no single file shows a smell for any of them. Instead, each one comes from code whose order of events was never stated.
So this guide treats JavaScript clean code practices as one idea at two scales. First, at the small scale, a clean line says what it does, so you can predict it by reading it. Then, at the large scale, clean async code says when things happen, so you can predict it by reading it too. In both cases, the test is the same. Could a colleague say what this code will do before running it?
// Tidy names, short function, unpredictable behaviour
let latestStock = [];

async function refreshStock() {
  latestStock = await fetchStock(); // which call wins if two overlap?
}
Every name here is clear, and the function is three lines long. However, if two refreshes overlap, the slower reply wins, and no linter warns about it. So a style guide alone would pass this code. That gap is why the second half of the guide exists.
Because of that, the practices run in a fixed order. First come names, small functions and modern syntax, the habits the study backs. Then come the event loop, cancellation, race conditions, pure functions and shared resources. Finally, an ESLint config turns as many of them as possible into errors, so review does not have to remember them.
Also, each practice comes with code before and after. The early examples suit someone in their first year of JavaScript. Then the later ones assume you have shipped async code and been burned by it. Finally, every speed claim comes from a measured run, and where a clean version is slower, the numbers say so.
Does clean code cost JavaScript any speed?#
Mostly not: on Node.js 26, guard clauses ran at 3.517 nanoseconds per call against 3.527 for nested ifs, while smell-free files carried a fault hazard at least 33% lower. The fault figure is from the Software Quality Journal study above. Meanwhile, the timings come from Atyantik's local Node.js benchmark of 3 October 2026. It ran on Node.js v26.10.0, macOS 26.6.2 and an Apple M1 with 8 cores and 16 GB of memory.
Show data table
| Dimension | before the rewrite | after the clean rewrite |
|---|---|---|
| guard clauses | 3.527 ns per call | 3.517 ns per call |
| optional chaining | 7.533 ns per call | 4.264 ns per call |
| options object | 0.781 ns per call | 0.937 ns per call |
Guard clauses and optional chaining cost nothing, and the options object is the one rewrite that measured slower, by a fraction of a nanosecond.
In short, a clean rewrite of control flow is free, sometimes faster, and once slightly slower. In that run, the optional chain with ?? came out faster than the && chain it replaced. Meanwhile, the options object cost about 0.16 nanoseconds more per call than five plain parameters. So at a million calls, that is a sixth of a millisecond.
But the method matters, because a careless micro-benchmark lies. For example, in an earlier pass, all the variants ran one after another in the same process. As a result, the variant that ran first looked slower, because the engine had not settled. So each variant now runs alone in a fresh process, seven processes each. Each process takes 15 samples of two million calls, and the figure printed is the median.
Still, a nanosecond result says less than it seems. Because the engine optimises small functions so well, the shape of your if statements rarely shows up in a profile. In practice, the slow parts of a JavaScript app are network calls, database queries, large copies and blocked event loops. So those are where the later sections spend their time, and where the measured gaps run to whole milliseconds.
How to measure a practice yourself#
When a teammate says a clean version is slower, measure it rather than argue. Node.js exposes a high-resolution clock as performance.now(), listed on its performance measurement page. So the smallest honest harness times many calls, repeats the timing, and reports the middle value.
// bench.mjs: run as `node bench.mjs before`, then `node bench.mjs after`
const variants = {
  before: (order) => {
    if (order) {
      if (order.paid) return order.total;
    }
    return 0;
  },
  after: (order) => {
    if (!order) return 0;
    if (!order.paid) return 0;
    return order.total;
  },
};

const run = variants[process.argv[2]];
const order = { paid: true, total: 42 };
const calls = 2_000_000;
const samples = [];
let sink = 0;

for (let sample = 0; sample < 15; sample += 1) {
  const start = performance.now();
  for (let call = 0; call < calls; call += 1) sink += run(order);
  samples.push(((performance.now() - start) * 1e6) / calls);
}

samples.sort((a, b) => a - b);
console.log(`${process.argv[2]}: ${samples[7].toFixed(3)} ns per call (median)`, sink > 0);
Three details keep it honest. First, each variant runs in its own process, because the first variant in a shared process pays for the engine's warm-up. Second, every result goes into sink, and sink gets printed, so the engine cannot skip the work. Finally, the median of several samples resists the one sample a background task slowed down. Even then, treat a gap of a few percent at this scale as noise, not as a finding.
Then set the fault side next to it. The Software Quality Journal paper of 22 March 2019 puts it directly: "files without code smells have hazard rates at least 33% lower than files with code smells". In particular, the authors used survival analysis, which measures how long a file goes before its first fault. So the finding is not that messy code looks worse. Instead, messy files break sooner.
For a team lead weighing JavaScript clean code practices, that is the sentence to take upstairs. Clean code is not polish added after the real work. Instead, it is a lever on bug rates that costs no measurable speed in the common case. And in the async cases later on, the clean version is often the faster one too.
How do names, small functions and modern syntax change JavaScript code?#
Every if or else-if adds one path to a function's single starting path, so ESLint's default complexity of 20 stays silent until the twentieth branch. That one fact explains why the basic JavaScript clean code practices matter. So a function can grow very large before any tool complains, so the habits below have to do the work first.
Names that explain the line#
Name a value for what it holds and a function for what it does, so the line reads without a comment beside it. Google's JavaScript style guide says it plainly: "Give as descriptive a name as possible, within reason". Also, it asks you not to shorten words by deleting letters, so customerId is fine and cstmrId is not. Still, the guide allows a single letter for a variable that lives for 10 lines or fewer. In short, a name should be as long as the distance it travels.
Similarly, MDN Web Docs updated its JavaScript code guidelines on 27 August 2026. They put it simply: "Good variable names are essential to understanding code". Also, they ask for camelCase, so currencyName rather than currency_name.
// Before: every name has to be decoded
const d = items.filter((x) => x.s && x.q > 0);

// After: the line explains itself
const inStockItems = items.filter((item) => item.isActive && item.quantity > 0);
In practice, three habits cover most cases. First, name booleans as questions, such as isPaid or hasStock. Second, start function names with a verb, such as calculateTotal or sendInvoice. Then keep comments for why the code does something, never for what it does, because the name already says what.
Numbers need names too. For example, a bare 3 or 15 in a condition forces the next person to guess what it means and whether it appears anywhere else. So give it a constant with a unit in the name, and the condition reads like the rule it is.
// Before: what are 3 and 15, and where else do they live?
if (user.failedLogins >= 3 && msSinceFailure < 15 * 60 * 1000) lockAccount(user);

// After: the rule reads as a rule, and changes in one place
const MAX_FAILED_LOGINS = 3;
const LOCKOUT_WINDOW_MS = 15 * 60 * 1000;

if (user.failedLogins >= MAX_FAILED_LOGINS && msSinceFailure < LOCKOUT_WINDOW_MS) {
  lockAccount(user);
}// Before: the comment does the name's job
// check if the user can see the report
function check(u, r) {
return u.role === "admin" || r.ownerId === u.id;
}
// After: the name does it, and the comment explains a decision
function canViewReport(user, report) {
// Admins see every report so support can reproduce issues.
return user.role === "admin" || report.ownerId === user.id;
}Guard clauses instead of nesting#
A guard clause returns early when a case is handled, so the main path sits at the left margin. The max-depth rule opens with a line most reviews would back: "Many developers consider code difficult to read if blocks are nested beyond a certain depth". And its default stops at 4. However, a function four blocks deep is already hard to follow, so an early return that skips a whole level is usually the better fix.
// Before: the real work sits three blocks deep
function shippingCost(order) {
  if (order) {
    if (order.items.length > 0) {
      if (!order.isPickup) {
        return order.weightKg * 2.5;
      }
    }
  }
  return 0;
}

// After: each guard handles one case and leaves
function shippingCost(order) {
  if (!order) return 0;
  if (order.items.length === 0) return 0;
  if (order.isPickup) return 0;
  return order.weightKg * 2.5;
}
Because both versions have the same number of paths, the complexity count does not change. Instead, what changes is the depth, and with it the number of conditions you must hold in mind at once. Also, as the benchmark above showed, the two shapes run at the same speed.
Few parameters, or one named object#
The max-params rule explains why long parameter lists hurt. Each call makes you remember what each value means, its type, and its place in the order. So with four or more inputs, pass one object and name its keys.
// Before: what do true and false mean here?
createUser("Asha", form.email, true, false, "en");

// After: the call explains itself, and order no longer matters
createUser({
  name: "Asha",
  email: form.email,
  isAdmin: true,
  sendWelcome: false,
  locale: "en",
});
In the benchmark, the options object was the one rewrite that came out slower, by about 0.16 nanoseconds per call. That is the honest cost of a readable call site, and it is far too small to matter outside the tightest loop.
Small functions, and the branch count behind the advice#
The complexity rule says cyclomatic complexity "measures the number of linearly independent paths through a program's source code". In the classic count, a function starts at 1 and each branch adds 1. So a checkout function with 4 rules has a complexity of 5. Then with 10 rules it is 11, and nothing is reported. And at 19 rules the complexity is 20, which equals the default, so ESLint still says nothing. So only the twentieth rule crosses the line.
When ESLint reports your function
Set the number of if or else-if branches in one function and the complexity max; the classic count is 1 plus each branch, as the ESLint complexity rule defines it.
Classic complexity of the function
20
- Paths over the limit
- 0
- Branches allowed before a report
- 19
Arithmetic from the ESLint complexity rule documentation, v10.12.0. Modelled, not measured.
As a result, the default is a poor guard against one of the study's riskiest smells. In practice, a function that checks twenty things is doing several jobs at once. Instead, split the checks into small named functions and call them in turn.
// Before: one function, many jobs, complexity climbing
function validateCheckout(cart, card, address) {
  if (cart.items.length === 0) return "Cart is empty";
  if (card.expiresAt < Date.now()) return "Card expired";
  if (!address.postcode) return "Postcode missing";
  // ...sixteen more checks
  return null;
}

// After: each piece is small, named and tested on its own
function validateCheckout(cart, card, address, now) {
  return validateCart(cart) ?? validateCard(card, now) ?? validateAddress(address);
}
Also, note one detail the rule's page spells out. Defaults like a = {} count as a path, and so does each ?. in a chain, since a?.b?.c adds two. So the count rises faster than the visible if statements suggest. The max-lines-per-function rule covers the opposite blind spot. Its own page shows a 16-line function of nested calls that the complexity rule scores as 1.
const by default, and no assignment inside a test#
Declaring with const removes the Variable Re-assign smell outright. The study calls it the most common smell, and also one of the riskiest. The prefer-const rule says: "If a variable is never reassigned, using the const declaration is better". It flags any let that never gets a new value, and --fix rewrites it for you. Alongside it, the no-var rule flags var and asks for block-scoped let or const. Its own page shows a var count inside an if block quietly overwriting the outer count.
// Before: total is reassigned in a loop, and status changes meaning
let total = 0;
for (const item of cart.items) total = total + item.unitCost * item.qty;
let status = total > 0 ? "ready" : "empty";

// After: each name holds one value for its whole life
const total = cart.items.reduce((sum, item) => sum + item.unitCost * item.qty, 0);
const status = total > 0 ? "ready" : "empty";
Then there is the assignment inside a test. Its rule is no-cond-assign. The page notes that "it is very easy to mistype a comparison operator (such as ==) as an assignment operator (such as =)". But its default still allows an assignment wrapped in parentheses, so set it to "always" to ban them all.
// Before: always true, and user is overwritten
if (user.role = "admin") grantAccess(user);

// After: a comparison, as intended
if (user.role === "admin") grantAccess(user);
Optional chaining and nullish coalescing#
Optional chaining with nullish coalescing replaces the nested null checks that deepen a function. MDN Web Docs' optional chaining page, updated on 22 May 2026, explains that ?. returns undefined instead of throwing when a value is null or undefined. As a result, one line replaces a stack of if (user && user.address) checks.
Meanwhile, nullish coalescing fixes a quiet bug in defaults. MDN's nullish coalescing page warns that || replaces any falsy value, so a real 0 or an empty string gets thrown away. Instead, the ?? operator only steps in for null or undefined.
// Before: deeper, and a quantity of 0 becomes 1
let qty = 1;
if (order && order.line && order.line.qty) qty = order.line.qty;

// After: flat, constant, and 0 stays 0
const qty = order?.line?.qty ?? 1;
In the benchmark, the optional chain was the one clear speed win among the small patterns, at 4.264 nanoseconds against 7.533. Even so, choose it for the bug it removes, not the speed. Because every test used a non-zero value, a discount of 0 that silently becomes the default is the kind of defect that ships.
Handle an error where you can act on it#
A catch block that logs and carries on hides the failure from everything above it. So the clean rule is to catch an error only where you can do something about it, and to add context when you pass it on.
// Before: the failure disappears, and the caller gets undefined
async function loadSettings(userId) {
  try {
    return await readSettings(userId);
  } catch (error) {
    console.log(error);
  }
}

// After: handle the one case you expect, pass on the rest with context
async function loadSettings(userId) {
  try {
    return await readSettings(userId);
  } catch (error) {
    if (error.code === "NOT_FOUND") return DEFAULT_SETTINGS;
    throw new Error(`Could not load settings for user ${userId}`, { cause: error });
  }
}
Now a missing record has a planned answer, and every other failure reaches a place that can report it. Also, the original error rides along as cause, so the stack trace that explains it is not lost.
When does a JavaScript one-liner help, and when does it hurt?#
A JavaScript one-liner helps when one line names one idea, like flat() at its default depth of 1, and hurts when an unexpected input, such as objects in a Set, breaks it.
So the test for a one line JavaScript expression is not its length. Instead, ask two questions. Does the line say one thing a colleague could name out loud? And does it still work on the input you did not plan for? Each of the four lines below passes the first test. Each one also has an input that breaks it. So the clean version is the one-liner with its limit known, or a plain statement.
Flatten an array with flat(), and know its depth#
MDN Web Docs' flat() page was updated on 10 July 2025. It describes the one argument as "The depth level specifying how deep a nested array structure should be flattened." That depth defaults to 1, and the default is the trap. A list nested one level deep comes out flat. However, data from a tree, or from an API (application programming interface) that nests further, keeps its inner arrays, and nothing warns you.
// Before: two loops and a push to flatten one level
const tags = [];
for (const post of posts) {
  for (const tag of post.tags) tags.push(tag);
}

// After: one line, one idea
const tags = posts.map((post) => post.tags).flat();

// The input that breaks it: deeper levels stay nested
[1, [2, [3, [4]]]].flat();         // [1, 2, [3, [4]]]
[1, [2, [3, [4]]]].flat(Infinity); // [1, 2, 3, 4]
The same page adds that "The flat() method removes empty slots if the array being flattened is sparse." So a flattened list can be shorter than you counted. The clean verdict is to keep flat() for data you know is one level deep. For anything deeper, write the depth, or pass Infinity when every level really should go.
Destructuring, and swapping two variables in one line#
MDN's destructuring page was updated on 10 August 2026. It puts it plainly: "Two variables values can be swapped in one destructuring expression." Without it, the same page notes, a swap needs a temporary variable. Destructuring in JavaScript also names the parts of a returned object at the point you use them.
// Before: a temporary variable just to swap
let temp = left;
left = right;
right = temp;

// After: the swap is one statement
[left, right] = [right, left];

// Destructuring also names what a call returns
const { id, email } = await getUser(userId);
Here the input that breaks it is the line above, not the data. MDN warns about code written without trailing semicolons. A destructuring line that opens with a parenthesis needs a semicolon before it, "or it may be used to execute a function on the previous line." A line that opens with a square bracket has the same problem. For example, const pair = getPair() followed by [left, right] = [right, left] on the next line reads as one statement. So keep semicolons, or let Prettier add them, and the one-line swap stays safe.
Remove duplicates with a Set, but only for plain values#
MDN's Set page, updated on 13 August 2026, says "A value in the set may only occur once". As a result, spreading a list into a JavaScript Set is the shortest honest way to drop repeated strings or numbers. It also keeps the first order, because a set is iterated "in insertion order".
Objects break it. The same page says of objects: "They are compared by reference, not by value." Two objects with the same fields are two different values, so both stay in the set.
// Works: strings and numbers
[...new Set(["js", "css", "js"])]; // ["js", "css"]

// Breaks: two objects with the same fields are still two objects
const users = [{ id: 1 }, { id: 1 }];
[...new Set(users)].length; // 2

// Clean: say what makes two items the same, here the id
const uniqueById = [...new Map(users.map((user) => [user.id, user])).values()];
In short, the Set one-liner is clean for plain values. For objects, the clean code names the key that decides sameness, so it is clear which duplicate wins. Here it is the last user seen with each id.
A one line if without an else#
Two short forms stand in for an if with no else, and only one of them is meant for it. MDN's logical AND page was updated on 8 July 2025. It says && evaluates "from left to right, returning immediately with the value of the first falsy operand it encounters". So isAdmin && showPanel() calls showPanel only when isAdmin is truthy.
The ternary is different, because it always has two branches. MDN's conditional operator page was updated on 8 July 2025. After the condition, it describes one expression "to execute if the condition is truthy". Then comes a colon and "the expression to execute if the condition is falsy." So a JavaScript ternary operator without an else is a syntax error. Writing ready ? start() : null is an if statement wearing a costume.
// Works as a one line if, but reads like a value
isAdmin && showPanel();

// The input that breaks it: a falsy value that is not false
const count = 0;
const badge = count && `${count} new`; // 0, not ""

// Clean: a plain if for an action, a ternary for a choice of values
if (isAdmin) showPanel();
const label = count > 0 ? `${count} new` : "";
The trap is the falsy value. The conditional operator page lists the falsy values as "null, NaN, 0, the empty string (""), and undefined". So count && ... hands back 0, and a template prints that 0 on screen. The clean verdict follows. Write if (cond) action(); when the line does something. Use the ternary when it picks between two values. Keep && for a left side that is a real boolean.
In what order does JavaScript run promises, nextTick, timers and animation frames?#
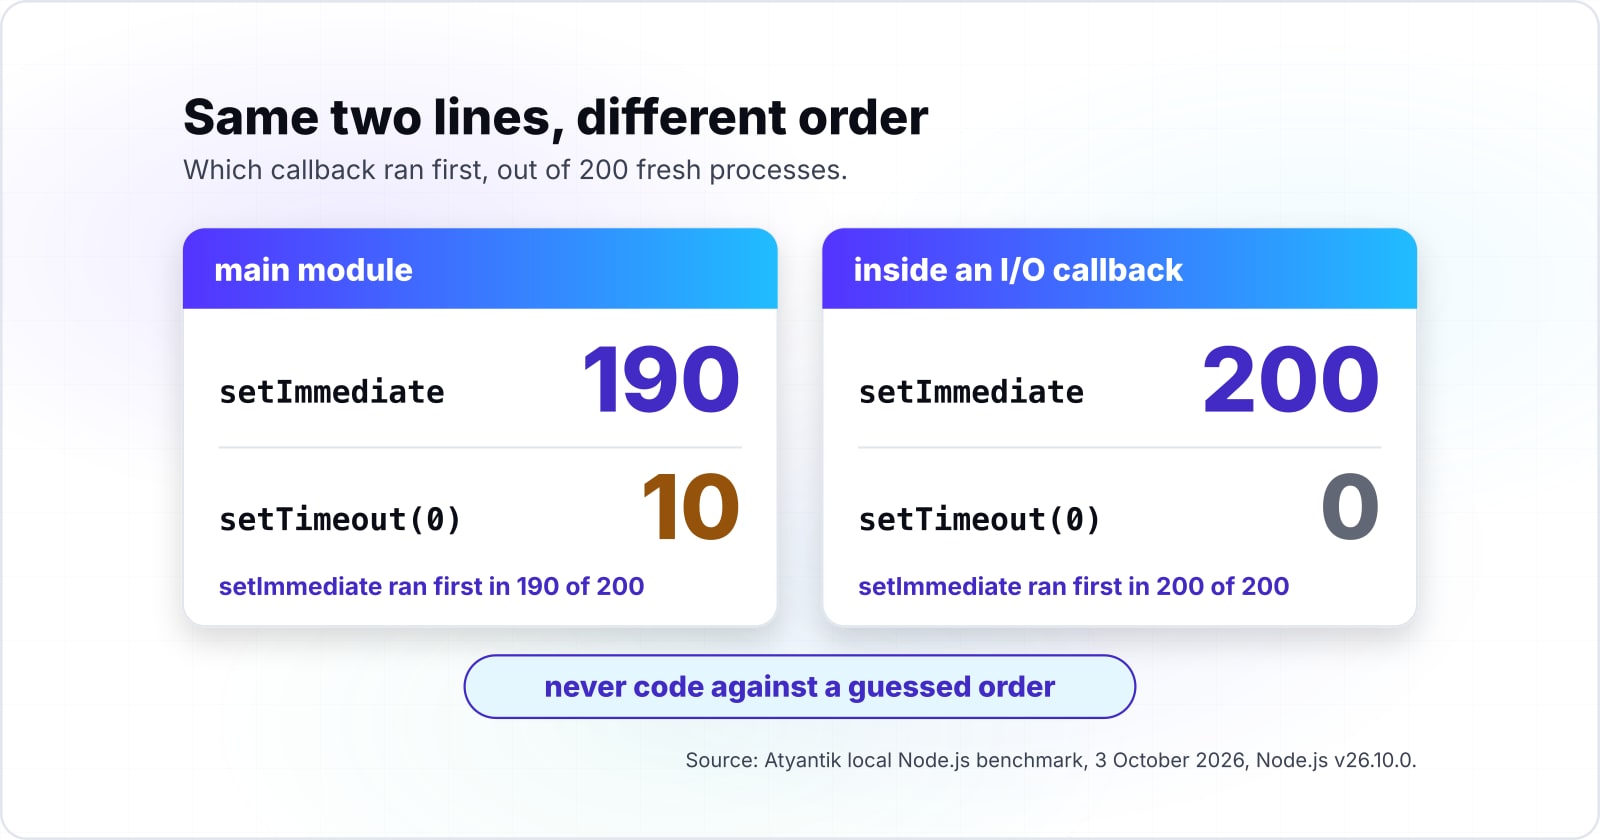
In 200 fresh Node.js processes, setImmediate beat setTimeout(0) 190 times from the main module and all 200 times inside an I/O callback, so never code against a guessed order. Those counts come from Atyantik's local Node.js benchmark of 3 October 2026, on Node.js v26.10.0. But the lesson is not the counts themselves. Instead, the same two lines ran in a different order depending on where they were called.
Show data table
| Item | Value |
|---|---|
| main module: setImmediate ran first | 190 processes out of 200 |
| main module: setTimeout(0) ran first | 10 processes out of 200 |
| inside an I/O callback: setImmediate ran first | 200 processes out of 200 |
The same two lines ran in a different order depending on where they were called, so code never relies on a guessed order.
The queues, in plain words#
JavaScript runs one piece of code at a time. When that code finishes, the runtime picks the next job from a set of queues, and the order of those queues is the whole story. First, the current synchronous code runs to the end. Then the microtasks run: promise callbacks and anything passed to queueMicrotask. Only then does the event loop move on to timers, I/O callbacks and, in Node.js, setImmediate.
MDN's microtask guide defines it exactly. "A microtask is a short function which is executed after the function or program which created it exits and only if the JavaScript execution stack is empty". So it runs before control returns to the event loop. Because of that, a resolved promise's then callback always runs before a setTimeout(fn, 0) scheduled at the same moment.
Node.js adds one more queue. Its process.nextTick guide says a nextTick callback is scheduled "to run immediately after the current call stack completes, before the event loop continues and before any other queued tasks or phases are processed". The same page warns that setTimeout(() => {}, 0) runs "much later" than nextTick.
The browser has one more name for a microtask. MDN's queueMicrotask page says the method "queues a microtask to be executed at a safe time prior to control returning to the browser's event loop". So queueMicrotask(fn) and Promise.resolve().then(fn) land in the same queue. So the difference is intent. When you want a microtask and no promise, queueMicrotask says so in one word.
Where an async function pauses#
One more rule trips up even experienced developers. An async function runs like a normal function until its first await. Only then does it hand control back, and the rest of its body runs later as a microtask.
// What does this print?
async function load() {
  console.log("A");
  await null;
  console.log("C");
}

load();
console.log("B");
// Prints A, B, C: the body runs at once up to the await, then resumes later
So code before the first await is not deferred at all. If an async function does heavy work before its first await, it blocks its caller just like any other function. Equally, code after an await always runs later, even when the awaited value is ready.
What the benchmark printed#
Here is the probe, run 200 times in fresh processes as an ES module:
// order.mjs: which callback runs first?
setTimeout(() => console.log("setTimeout"), 0);
setImmediate(() => console.log("setImmediate"));
process.nextTick(() => console.log("nextTick"));
Promise.resolve().then(() => console.log("promise.then"));
queueMicrotask(() => console.log("queueMicrotask"));
console.log("sync");
From the top level of the module, every one of the 200 runs printed sync, then promise.then, then queueMicrotask, then nextTick. So in an ES module, the promise callbacks ran before nextTick, even though the nextTick guide says nextTick runs first. But inside an I/O callback, such as the callback of fs.readFile, the order changed. There, all 200 runs printed nextTick before promise.then, which is the order the guide describes.
Then come the two timers. The Node.js event loop guide says that from the main module, the order of setTimeout(0) and setImmediate "is non-deterministic, as it is bound by the performance of the process". And the benchmark agrees: setTimeout won 10 times in 200. Then the same guide says that inside an I/O cycle, "the immediate callback is always executed first". The benchmark agrees again, 200 times in 200.
The browser adds paint#
A browser has no setImmediate and no process.nextTick, but it has a step Node.js lacks: rendering. MDN's requestAnimationFrame page says the method asks the browser "to call a user-supplied callback function before the next repaint". It adds that the callback rate "will generally match the display refresh rate", most commonly 60 times a second.
The HTML standard's event loop puts those pieces in order. A task runs, then the microtask queue drains, and only at a rendering opportunity does the browser run the animation frame callbacks and update the rendering. So a style change made in a promise callback is not painted until every microtask is done.
// Before: hoping the browser paints between the two lines
box.classList.add("start");
box.classList.add("end"); // the start state is never painted

// After: paint the start state, then move on the next frame
box.classList.add("start");
requestAnimationFrame(() => {
  requestAnimationFrame(() => box.classList.add("end"));
});
The nested call is deliberate. Because the first callback runs before the paint that shows the start state, the second one waits for the frame after it.
The clean habit: write the order down#
Ordering bugs come from guessing which queue runs first. So the fix is never a smarter guess. Instead, state the dependency in code, so the order cannot change when a call moves from the main module into a callback.
// Before: relies on setTimeout running after the save
saveDraft(draft);
setTimeout(() => showToast("Saved"), 0);

// After: the order is in the code, not in the event loop
await saveDraft(draft);
showToast("Saved");
In short, await, a then chain or a callback passed in is a contract, and writing the order down is one of the JavaScript clean code practices that removes flaky tests. But a setTimeout(fn, 0) placed after a call is a hope. The same goes for a test that passes only because a nextTick happens to run first. That test describes the event loop of one entry point, not the behaviour of the code.
// Before: passes only while nextTick happens to run before promises
test("emits ready", () => {
  let ready = false;
  emitter.on("ready", () => {
    ready = true;
  });
  emitter.start(); // emits "ready" from a process.nextTick callback
  return Promise.resolve().then(() => expect(ready).toBe(true));
});

// After: the test waits for the event itself
test("emits ready", async () => {
  const ready = new Promise((resolve) => emitter.once("ready", resolve));
  emitter.start();
  await ready;
});
Because the before version races a promise callback against a nextTick, its result depends on where it runs. As the benchmark showed, the winner of that race changed between an ES module's top level and an I/O callback. The after version has no race to lose, so it passes everywhere or fails for a real reason.
How can a long microtask chain freeze timers, I/O and rendering?#
A queueMicrotask chain of two hundred thousand work items held a setTimeout(0) back for a median 50.17 milliseconds, while setImmediate chunks of 1,000 kept it to 0.67. Those figures come from Atyantik's local benchmark of 3 October 2026, the median of 11 runs. The yielding version also finished the whole batch sooner, in 43.33 milliseconds against 50.13.
Show data table
| Dimension | one queueMicrotask chain | setImmediate chunks of 1,000 |
|---|---|---|
| timer lag while the batch runs | 50.17 milliseconds | 0.67 milliseconds |
| total batch time | 50.13 milliseconds | 43.33 milliseconds |
Yielding in chunks cut the timer's wait from 50.17 to 0.67 milliseconds and the batch still finished sooner.
In short, microtasks are not a background thread. Instead, they run to empty before the loop moves on, so a long chain blocks timers, network callbacks and, in a browser, every paint. Many developers expect promise-based work to be non-blocking because it is "async". But it is not. A promise only defers work to a moment before the next task. It does not run that work anywhere else.
Node.js documents the same trap for nextTick. Its event loop guide warns that recursive process.nextTick() calls let you "starve" your I/O, "which prevents the event loop from reaching the poll phase". So a chain of promise callbacks does the same thing for the same reason.
// Before: every item as one long microtask chain
function processAll(items, handle) {
  let index = 0;
  function step() {
    if (index >= items.length) return;
    handle(items[index]);
    index += 1;
    queueMicrotask(step); // never yields to timers or I/O
  }
  step();
}
Chunk the work and yield#
So the fix is to do the work in chunks and give the loop a turn between them. Node.js ships a promise form of setImmediate in node:timers/promises, which makes the yield one line.
// After: chunks of 1,000, yielding to the event loop between them
import { setImmediate as yieldToLoop } from "node:timers/promises";

async function processAll(items, handle, chunkSize = 1000) {
  for (let start = 0; start < items.length; start += chunkSize) {
    for (const item of items.slice(start, start + chunkSize)) handle(item);
    await yieldToLoop(); // timers, I/O and other requests run here
  }
}
In a browser, the same shape works with a short setTimeout between chunks, or with requestAnimationFrame when each chunk changes what is on screen. So the chunk size is a dial, and chunking long batches belongs on any list of JavaScript clean code practices for async code. Smaller chunks keep the page smoother, while larger chunks finish the batch with fewer yields.
// Browser version: a zero-delay timer between chunks lets the page paint
const yieldToBrowser = () => new Promise((resolve) => setTimeout(resolve, 0));

async function renderRows(rows, table, chunkSize = 200) {
  for (let start = 0; start < rows.length; start += chunkSize) {
    for (const row of rows.slice(start, start + chunkSize)) table.append(renderRow(row));
    await yieldToBrowser(); // input and paint get a turn here
  }
}
Notice that the browser version yields with a timer, not with a promise. A promise would put the next chunk back in the microtask queue, and the paint would wait for it again. So the yield has to be a task, which is exactly what the earlier section on queues predicts.
Why was the chunked version faster overall? The benchmark cannot say for certain, and a guess is not a finding. Still, it does show that yielding did not cost speed in this case, so there was no trade to make. In practice, the main gain is still the timer lag: two thirds of a millisecond instead of fifty, which is the difference between a server that answers health checks during a batch and one that does not.
How do AbortController and AbortSignal cancel fetch and stale async work?#
In 200 simulated type-ahead sessions, 109 ended showing a stale result without cancellation and none did when each keystroke aborted the previous request with AbortController. That simulation is part of Atyantik's local Node.js benchmark of 3 October 2026. Each session typed six keystrokes 40 milliseconds apart. Each simulated request then took anywhere from 20 milliseconds to just under a third of a second, drawn from a seeded generator so both versions saw the same delays.
Stale sessions, no cancellation (modelled)
110 of 200Stale sessions, AbortController (modelled)
0 of 200Most sessions end on stale results
AbortController: none staleA slower reply for an older keystroke lands after the newest one and overwrites it. Aborting the request before each new one leaves only the newest reply able to reach the screen.
| keystrokes per session | 6 |
|---|---|
| gap between keystrokes | 40 ms |
| server reply | 20 to 299 ms |
| stale, no cancellation (modelled) | 110 of 200 |
| stale, no cancellation (measured) | 109 of 200 |
| stale, AbortController (modelled) | 0 of 200 |
| stale, AbortController (measured) | 0 of 200 |
109 of 200
No cancellation
0 of 200
AbortController per keystroke
Aborting the previous request on each keystroke removed every stale result in the measured run.
| Option | stale sessions of 200 |
|---|---|
| No cancellation | 109 of 200 |
| AbortController per keystroke | 0 of 200 |
Why the old answer wins#
The bug is simple once you see it. For example, a user types "re", then "rea", then "react". So three requests leave in that order, but nothing makes them come back in that order. If the reply for "rea" is slow, it lands after the reply for "react" and overwrites it. As a result, the box says "react" and the list shows results for "rea".
In the simulation, that happened in more than half the sessions. The gap between keystrokes is the dial that matters. When keystrokes come faster than the spread of server delays, a slower old reply has more chances to land last. So the faster a user types, the more often they see the wrong list.
// Before: whichever response arrives last wins
input.addEventListener("input", async () => {
  const response = await fetch(`/api/search?q=${encodeURIComponent(input.value)}`);
  renderResults(await response.json());
});
One controller per request#
MDN's AbortController page says its abort() method "Aborts an asynchronous operation before it has completed". It adds that this "is able to abort fetch requests, consumption of any response bodies, and streams". So the clean version keeps the controller for the request in flight and aborts it when a newer one starts.
// After: each new keystroke cancels the request before it
let controller = null;

input.addEventListener("input", async () => {
  controller?.abort();
  controller = new AbortController();
  try {
    const response = await fetch(`/api/search?q=${encodeURIComponent(input.value)}`, {
      signal: controller.signal,
    });
    renderResults(await response.json());
  } catch (error) {
    if (error.name !== "AbortError") throw error; // a cancel is not a failure
  }
});
Two details make this correct. First, the abort also stops reading the response body, so a cancelled reply cannot reach renderResults halfway. Second, an aborted fetch rejects with an AbortError. Treat that as the expected end of a request that is no longer wanted, not as an error to log or show.
Cancel when the work's owner goes away#
A search box is one owner of async work. A screen, a dialog or a background job is another. When the owner closes, every request it started should stop with it, or a late reply will try to update something that no longer exists.
// Before: a late reply renders into a view that has closed
function openReportView(id) {
  loadReport(id).then(renderReport);
}

// After: the view owns a controller and aborts it on close
function openReportView(id) {
  const controller = new AbortController();
  loadReport(id, controller.signal).then(renderReport);
  return function close() {
    controller.abort(); // no late render into a closed view
  };
}
So the clean rule is one controller per owner. The owner creates it, passes its signal to everything it starts, and calls abort() once when it ends.
A timeout without a stray timer#
A request with no time limit can hang a feature for as long as the network allows. MDN's AbortSignal.timeout page says the method "returns an AbortSignal that will automatically abort after a specified time". Also, the signal aborts with a TimeoutError, so the catch block can tell a timeout from a user cancel.
// Before: a hand-made timer that must be cleared on every path
const controller = new AbortController();
const timer = setTimeout(() => controller.abort(), 5000);
try {
  return await fetch(url, { signal: controller.signal });
} finally {
  clearTimeout(timer);
}

// After: the signal owns its own deadline
return fetch(url, { signal: AbortSignal.timeout(5000) });
Combining a user cancel with a deadline#
But real code often needs both: stop when the user leaves, and stop after five seconds. MDN's AbortSignal.any page describes a method that "takes an iterable of abort signals and returns an AbortSignal". The page adds that "The returned abort signal is aborted when any of the input iterable abort signals are aborted".
// Advanced: one signal that fires on a user cancel or a timeout
async function loadReport(id, userSignal) {
  const signal = AbortSignal.any([userSignal, AbortSignal.timeout(5000)]);
  try {
    const response = await fetch(`/api/reports/${id}`, { signal });
    return await response.json();
  } catch (error) {
    if (error.name === "TimeoutError") return { status: "timed-out" };
    if (error.name === "AbortError") return { status: "cancelled" };
    throw error;
  }
}
Cancellation is not only for fetch#
Also, the same signal works outside the browser. Node.js accepts it in node:timers/promises, where an aborted timer rejects with an AbortError. So a retry delay, a polling loop or a batch job can stop the moment its caller gives up.
// A polling loop that stops when its signal fires
import { setTimeout as sleep } from "node:timers/promises";

async function pollStatus(jobId, signal) {
  while (true) {
    const status = await getStatus(jobId, { signal });
    if (status.done) return status;
    await sleep(1000, undefined, { signal }); // rejects at once on abort
  }
}
In short, one of the most useful JavaScript clean code practices is to accept a signal in any function that starts slow work, and pass it down to every call that supports one. That single parameter is what lets a caller say "I no longer need this", and it is the first defence against the races in the next section.
Which race conditions hide behind await, and how are they fixed?#
Five independent 50 millisecond calls took a median 260.07 milliseconds awaited one by one and 52.4 with Promise.all, and the same await is where shared state goes stale. Those medians come from Atyantik's local Node.js benchmark of 3 October 2026, 21 runs per version on Node.js v26.10.0.
260.07 ms
Awaited one by one
52.4 ms
Promise.all
Five independent 50 millisecond calls took 260.07 milliseconds in sequence and 52.4 with Promise.all.
| Option | wall time |
|---|---|
| Awaited one by one | 260.07 ms |
| Promise.all | 52.4 ms |
In short, every await is a pause in your function and a chance for other code to run. And that has two faces. Used well, it lets independent work overlap, which is why the parallel version finished in about the time of one call. But used carelessly, it lets other code change the state your function read before the pause.
Sequential awaits that should run together#
ESLint's no-await-in-loop rule describes the first face. Awaiting inside a loop "may indicate that the program is not taking full advantage of the parallelization benefits of async/await". Its fix is to "create all the promises at once, then get access to the results using Promise.all()".
// Before: each request waits for the one before it
async function loadProfiles(ids) {
  const profiles = [];
  for (const id of ids) {
    profiles.push(await fetchProfile(id));
  }
  return profiles;
}

// After: all requests start together
async function loadProfiles(ids) {
  return Promise.all(ids.map((id) => fetchProfile(id)));
}
Know how Promise.all fails, though. MDN's Promise.all page says it "rejects when any of the input's promises rejects, with this first rejection reason". Meanwhile, the other requests keep running, and their results are thrown away. When each result matters on its own, use Promise.allSettled and handle every outcome. Also, a thousand ids means a thousand requests at once, so for a long list, run fixed-size batches instead.
// Parallel, but at most ten requests in flight at a time
async function loadAllProfiles(ids, batchSize = 10) {
  const profiles = [];
  for (let start = 0; start < ids.length; start += batchSize) {
    const batch = ids.slice(start, start + batchSize);
    // eslint-disable-next-line no-await-in-loop -- each batch waits for the last on purpose
    profiles.push(...(await Promise.all(batch.map((id) => fetchProfile(id)))));
  }
  return profiles;
}
Here the await inside the loop is deliberate, so the disable comment says why. That comment is the difference between a rule ignored and a rule applied with judgment.
Check, then await, then act#
The second face is the classic race. A function checks some state, awaits, and then acts on what it checked. By the time it acts, the state may have changed.
// Before: two callers both see an empty cache and both load
const cache = new Map();

async function getUser(id) {
  if (!cache.has(id)) {
    const user = await loadUser(id); // a second caller runs here
    cache.set(id, user);
  }
  return cache.get(id);
}
For example, two calls for the same id, a millisecond apart, both find the cache empty. Both send a request, and the later reply silently replaces the earlier one. So the fix is to store the promise itself, at once, before any await. Then the second caller finds the request already in flight and shares it.
// After: the first caller stores the promise, later callers share it
const cache = new Map();

function getUser(id) {
  if (!cache.has(id)) {
    const pending = loadUser(id).catch((error) => {
      cache.delete(id); // do not cache a failure forever
      throw error;
    });
    cache.set(id, pending);
  }
  return cache.get(id);
}Reading before an await and writing after it#
ESLint's require-atomic-updates rule is named for this pattern. Its page warns that "When writing asynchronous code, it is possible to create subtle race condition bugs". Its example is a running total.
// Before: += reads totalLength, awaits, then writes a stale sum
let totalLength = 0;

async function addLengthOfSinglePage(pageNum) {
  totalLength += await getPageLength(pageNum);
}

// After: await first, then read and write with no pause between
async function addLengthOfSinglePage(pageNum) {
  const length = await getPageLength(pageNum);
  totalLength += length;
}
In the before version, += reads totalLength first and then waits. So two calls running at once both read 0, and the second write discards the first. In the after version, the read and the write happen together, with no await in between.
So the cleanest fix of all is to share no counter. Instead, have each call return its value and add them at the end, with Promise.all and a sum. Shared mutable state across awaits is the root of the bug, so the best code has none.
When you cannot cancel, check that the answer is still wanted#
But some work cannot be aborted, such as a library call that takes no signal. In that case, tag each request and drop any answer that is not the latest.
// A request counter guards the render when cancellation is not available
let latestRequest = 0;

async function search(query) {
  const requestId = ++latestRequest;
  const results = await legacySearch(query); // takes no signal
  if (requestId !== latestRequest) return; // a newer search has started
  renderResults(results);
}
This stops the stale render, but the old work still runs to the end. So prefer a signal wherever the API accepts one, and keep the counter for the places it does not.
A double submit is check-then-act too#
The same race happens with a person on the other end. For example, a user clicks Pay, nothing changes for a moment, and they click again. Then each click starts its own request, and nothing in the code says only one may run.
// Before: two quick clicks place two orders
button.addEventListener("click", async () => {
  await placeOrder(cart);
});

// After: one order in flight at a time, shared by every click
let pendingOrder = null;

button.addEventListener("click", () => {
  pendingOrder ??= placeOrder(cart).finally(() => {
    pendingOrder = null;
  });
  return pendingOrder;
});
The after version uses the same idea as the cache: store the promise before any await, so the second click finds it. Even so, the server should also refuse a duplicate order, because a client fix cannot stop a retry from another tab.
The same race in the database#
Read, await, write is just as dangerous on the server, where two requests share one database row. For example, a stock check that reads the count, decides in JavaScript, and writes the new count back can sell the last item twice.
// Before: two requests both read stock 1, and both sell
async function reserveItem(pool, itemId) {
  const res = await pool.query("SELECT stock FROM items WHERE id = $1", [itemId]);
  if (res.rows[0].stock < 1) return false;
  await pool.query("UPDATE items SET stock = $1 WHERE id = $2", [res.rows[0].stock - 1, itemId]);
  return true;
}

// After: the check and the write are one statement, so they cannot interleave
async function reserveItem(pool, itemId) {
  const res = await pool.query(
    "UPDATE items SET stock = stock - 1 WHERE id = $1 AND stock > 0",
    [itemId],
  );
  return res.rowCount === 1;
}
Because the database applies the condition and the change together, there is no gap for a second request to slip into. So when shared state lives in a database, move the check into the write rather than guarding it in JavaScript.
How do pure functions and module singletons keep side effects in one place?#
Pure functions hold the logic and one module-scoped resource holds the side effect: a single shared keep-alive agent served local requests in 44.3 microseconds against 117.1 with fresh connections. Those medians come from Atyantik's local benchmark of 3 October 2026, 11 runs of five hundred sequential requests each to a server on the same machine.
Show data table
| Item | Value |
|---|---|
| new connection per request | 117.1 microseconds per request |
| one module-scoped keep-alive agent | 44.3 microseconds per request |
One module-scoped keep-alive agent served each local request in 44.3 microseconds against 117.1 with a fresh connection.
In short, the clean shape and the fast shape agree here. Logic that only takes inputs and returns outputs is easy to test. Meanwhile, the resources that touch the outside world, such as connections, are expensive to create, so they are made once and shared.
What makes a function pure#
A pure function returns the same output for the same input, and changes nothing outside itself. It reads no clock, no random number, no global and no network. Because of that, a test can call it with a value and check the answer, with no setup, no mocks and no waiting.
Most functions are impure for one small reason, such as a hidden call to Date.now(). So that one call makes the result depend on when the test runs. Instead, pass the time in.
// Before: the answer depends on when you call it
function isTrialExpired(user) {
  return Date.now() > user.trialEndsAt;
}

// After: the caller passes the time, so a test can choose it
function isTrialExpired(user, now) {
  return now > user.trialEndsAt;
}

isTrialExpired(user, Date.now()); // in the app
isTrialExpired({ trialEndsAt: 10 }, 11); // in a test: true, every time
Randomness works the same way. Because a function that calls Math.random() inside returns a different answer each time, it cannot be tested for a specific outcome. Instead, pass the random source in, so a test can supply a fixed one.
// Before: untestable without luck
function pickWinner(entries) {
  return entries[Math.floor(Math.random() * entries.length)];
}

// After: the random source is an input
function pickWinner(entries, random = Math.random) {
  return entries[Math.floor(random() * entries.length)];
}

pickWinner(["a", "b", "c"], () => 0.5); // always "b"
Do not change what you were given#
A pure function also leaves its inputs alone. When a function sorts or edits an array it was passed, every other holder of that array sees the change, and the bug shows up far from its cause.
// Before: sorts the caller's array in place
function topScores(scores) {
  return scores.sort((a, b) => b - a).slice(0, 3);
}

// After: works on a copy, so the caller's order survives
function topScores(scores) {
  return [...scores].sort((a, b) => b - a).slice(0, 3);
}
For nested data, two built-ins help, and each has a limit to know. MDN's Object.freeze page warns that a frozen object "is not necessarily constant", because "freeze is shallow": nested objects can still change. Meanwhile, MDN's structuredClone page says the method "creates a deep clone of a value using the structured clone algorithm". So use the clone when a function must hand back a changed copy of deep data, and freeze for config that should never change at the top level.
Configuration is a quiet side effect of its own. A function that reads process.env deep inside depends on the environment at the moment it runs, so read it once at startup instead.
// Before: every call reads the environment, and a typo fails late
function paymentTimeoutMs() {
  return Number(process.env.PAYMENT_TIMEOUT_MS || 5000);
}

// After: read once, checked once, frozen at the top level
export const config = Object.freeze({
  paymentTimeoutMs: Number(process.env.PAYMENT_TIMEOUT_MS ?? 5000),
});
As a result, the rest of the code takes config.paymentTimeoutMs as a plain value. Then a test passes its own config object, and no test has to change the environment of the whole process.
A pure core with an effectful edge#
When you put these JavaScript clean code practices together, a clear shape appears. First, the core of a feature is pure functions that decide. Then the edge is a thin layer that reads the clock, calls the database and sends the email, then hands plain values to the core.
// Before: the decision is buried inside the side effects
async function renewSubscriptions() {
  const subs = await db.query("SELECT * FROM subscriptions");
  for (const sub of subs.rows) {
    if (Date.now() > sub.endsAt && sub.autoRenew && sub.failures < 3) {
      await billing.charge(sub.customerId, sub.plan);
    }
  }
}

// After: a pure rule, and an edge that only gathers and acts
export function shouldRenew(sub, now) {
  return now > sub.endsAt && sub.autoRenew && sub.failures < 3;
}

export async function renewSubscriptions({ db, billing, now = Date.now() }) {
  const subs = await db.query("SELECT * FROM subscriptions");
  const due = subs.rows.filter((sub) => shouldRenew(sub, now));
  await Promise.all(due.map((sub) => billing.charge(sub.customerId, sub.plan)));
}
Now shouldRenew is tested with plain objects in microseconds. Meanwhile, the edge function is tested once with fakes for db and billing, since they are passed in. Also, the business rule reads as one line a product owner could check.
One database pool per process#
But the edge needs resources, and some of them must exist once per process. A database pool is the clearest case. The node-postgres pooling page explains why pools exist: "Connecting a new client to the PostgreSQL server requires a handshake which can take 20-30 milliseconds". It also warns that "Creating an unbounded number of pools defeats the purpose of pooling at all".
// Before: a new pool, and new connections, on every request
import pg from "pg";
const { Pool } = pg;

export async function getUser(id) {
  const pool = new Pool(); // handshakes again, and never ends
  const res = await pool.query("SELECT * FROM users WHERE id = $1", [id]);
  return res.rows[0];
}
Instead, the clean version creates the pool at module scope. The Node.js modules documentation explains why that is enough: "Modules are cached after the first time they are loaded". It adds that every require('foo') call "will get exactly the same object returned, if it would resolve to the same file". So every file that imports the pool gets the same one.
// db.js: one pool for the whole process
import pg from "pg";
const { Pool } = pg;

export const pool = new Pool();

// users.js imports { pool } from db.js, so every caller shares it

export async function getUser(id) {
  const res = await pool.query("SELECT * FROM users WHERE id = $1", [id]);
  return res.rows[0];
}
Also, the keep-alive benchmark shows the same effect for HTTP connections on one machine, where the shared agent cut the time per request by more than half. Over a real network, and with a database handshake of 20 to 30 milliseconds, the gap between a fresh connection and a reused one is far larger.
When a singleton bites#
Module singletons have two known failure modes. First, tests. Because a pool opened by an import keeps the test process alive, close it once at the end. The pooling page gives the call: pool.end() "will wait for all checked-out clients to be returned and then shut down all the clients and the pool timers". Better still, pass the pool into the edge functions, as renewSubscriptions does, so a unit test never opens a real one.
Second, the cache is per resolved file, not per name. The modules page warns that require('foo') is not guaranteed to return "the exact same object, if it would resolve to different files". So two copies of the same package in node_modules, or a tool that clears the module cache, can each create their own pool. Also, a dev server that re-runs a module on every save creates a fresh pool each time unless the old one is ended. If your connection count climbs while you edit, look there first.
Lazy creation and a clean shutdown#
But a pool created at import time opens connections even in a script that never queries. So many teams create it on first use instead, and close it once when the process stops.
// db.js: create on first use, close once at shutdown
import pg from "pg";
const { Pool } = pg;

let pool = null;

export function getPool() {
  pool ??= new Pool();
  return pool;
}

export async function closePool() {
  if (pool) await pool.end();
  pool = null;
}

process.on("SIGTERM", async () => {
  await closePool(); // let checked-out clients finish first
  process.exit(0);
});
Because getPool always returns the same pool, the singleton holds. Also, closePool gives tests and shutdown one place to end it, which is the pool.end() call the node-postgres page describes.
Which documentation pages should the setup be built from?#
Build from eight official pages in this order: ESLint configuration files, prefer-const, complexity, no-await-in-loop, require-atomic-updates, AbortSignal.any, Node.js modules and node-postgres pooling. Together they let you write and defend every rule and every async pattern above, since each page gives one piece.
Shape the file
ESLint's configuration files page: the shape of eslint.config.js, an array of config objects, and how files and ignores pick which files a block applies to.
Default to const
prefer-const: which let declarations it flags, and that --fix rewrites them.
Cap the paths
complexity: the max option, the default of 20, and the "modified" variant for switch statements.
Catch serial awaits
no-await-in-loop: the sequential-await pattern, the Promise.all fix, and the cases where a loop should stay sequential.
Catch stale writes
require-atomic-updates: the read, await, write pattern and the allowProperties option.
Combine cancel signals
MDN's AbortSignal.any page: combining a user cancel with a timeout in one signal.
Share one module
Node.js modules: the module cache that makes a module-scoped singleton work, and its limits.
Pool the connections
node-postgres pooling: one pool, pool.query, and pool.end() at shutdown.
The eight pages, in order: configuration files page, prefer-const, complexity, no-await-in-loop, require-atomic-updates, AbortSignal.any page, modules, pooling.
Three more pages are worth a bookmark. First, the Node.js event loop guide explains the phases behind the ordering results. Then the bulk suppressions page covers rolling the rules out on old code. Finally, Prettier's rationale page explains what the formatter decides, so none of it needs a lint rule.
What does a minimal eslint.config.js for clean code look like?#
ESLint's defaults allow 3 parameters, 4 levels of nesting, 50 lines and 20 paths, so a short eslint.config.js tightens them and adds the two async rules. Put the file at the root of the project. The limits below are a starting point to tune, not a standard.
Show data table
| Item | Value |
|---|---|
| complexity (paths per function) | 20 |
| max-nested-callbacks (callback depth) | 10 |
| max-lines-per-function (lines) | 50 |
| max-depth (block nesting) | 4 |
| max-params (parameters) | 3 |
ESLint's defaults allow 3 parameters, 4 levels of nesting, 50 lines and 20 paths, so the config below tightens them.
// eslint.config.js
// 1. Export an array of config objects, scoped with files and ignores.
import { defineConfig } from "eslint/config";

export default defineConfig([
  {
    files: ["src/**/*.js"],
    ignores: ["src/generated/**"],
    rules: {
      // 2. Variables: const by default, no var, no assignment in a test.
      "prefer-const": "error",
      "no-var": "error",
      "no-cond-assign": ["error", "always"],
      // 3. Size: fewer paths, shallow blocks, few inputs, short bodies.
      complexity: ["error", { max: 10 }],
      "max-depth": ["error", 3],
      "max-params": ["error", 3],
      "max-lines-per-function": ["error", { max: 50, skipBlankLines: true, skipComments: true }],
      // 4. Async: no accidental sequential awaits, no stale writes.
      "no-await-in-loop": "error",
      "require-atomic-updates": "error",
      // 5. Formatting: none here. Prettier owns it.
    },
  },
]);
So the config is where JavaScript clean code practices stop being advice and start being checks. Run npx eslint . once to see where you stand. Then run npx eslint --fix . and let prefer-const and no-var repair what they can. The complexity limit of 10 is half the default, so it reports the checkout function from earlier at its tenth branch. If your code is far over, start at 15 and step down.
Formatting stays out of the file on purpose. MDN's guidelines say "we use Prettier as a code formatter to keep the code style consistent (and to avoid off-topic discussions)". And Prettier's rationale adds that it "only prints code. It does not transform it". So it will never turn a let into a const. That is ESLint's job, and it is the one tied to faults.
Rolling it out on an existing codebase#
Smells are usually introduced when a file is created, so apply the strict config to new and touched files first. The Software Quality Journal study found that smells, "particularly Variable Re-assign," are "often introduced in the application when the files containing them are created". It also found they "tend to remain in the applications for a long period of time".
ESLint's bulk suppressions feature was built for this case. After you turn a rule on as "error", run eslint --fix --suppress-all. The page explains that "the rule will be enforced for new code" while the existing violations are not reported. Then the command writes an eslint-suppressions.json file, so commit it and everyone shares one baseline. And when someone fixes an old violation, eslint --prune-suppressions removes the stale entry, and the list only shrinks.
Finally, make the check part of the build, so no change can skip it. A script in package.json gives every developer and every pipeline the same command.
{
  "scripts": {
    "lint": "eslint .",
    "format": "prettier --write ."
  }
}
Run npm run lint in the pipeline and fail the build on any error. Once that is in place, the practices hold on every commit, and review time goes to logic instead of style. Open source frontend projects work the same way: React and Svelte both ask for a passing lint run before they merge, as the guide on how to contribute to open source as a frontend developer shows.
When is a clean code rule the wrong tool?#
Copy-on-write updates cost 54.6 nanoseconds against 2.9 for mutation at 10 items and 732,990 against 7.5 at 100,000, so a hot path over large arrays mutates locally. Those medians come from Atyantik's local Node.js benchmark of 3 October 2026, 15 samples per size on Node.js v26.10.0. At 1,000 items, the same benchmark measured 3,462 nanoseconds for the copy against 12.1 for the mutation.
Show data table
| Dimension | in-place mutation | pure copy (map and spread) |
|---|---|---|
| 10 items | 2.9 ns per update | 54.6 ns per update |
| 1,000 items | 12.1 ns per update | 3,462 ns per update |
| 100,000 items | 7.5 ns per update | 732,990 ns per update |
Mutation stays near flat while a pure copy climbs with the array, so a hot path over large arrays mutates locally.
Copying large arrays in a hot loop#
In short, copying grows with the size of the data, while changing one item does not. For a ten-item settings list, the copy is free in any sense that matters. For a 100,000-row table updated in a loop, the copy turns a fast loop into a slow one. So a copy of that size takes most of a millisecond, every update.
Instead, the better tool is local mutation inside a pure boundary. Copy once at the start, change the copy freely inside the function, and return it. So from the outside the function is still pure, since its caller's data is untouched.
// Too costly: a full copy for every single update
let rows = initialRows;
for (const update of updates) {
  rows = rows.map((row) => (row.id === update.id ? { ...row, ...update } : row));
}

// Better: one copy, local mutation, and the caller's array is untouched
function applyUpdates(initialRows, updates) {
  const rows = [...initialRows];
  const indexById = new Map(rows.map((row, index) => [row.id, index]));
  for (const update of updates) {
    const index = indexById.get(update.id);
    rows[index] = { ...rows[index], ...update };
  }
  return rows;
}
Flat switches, generated code and serial awaits#
Second, a long switch can be clear and still exceed the classic count. The complexity rule's page shows a switch with three cases, a default and one if, whose classic complexity is 5 but whose modified complexity is only 3. The "modified" variant counts each switch as 1, however many cases it holds. So for reducers and command routers, set variant: "modified" rather than raising the max for everyone.
Third, generated code was never meant to be read. A parser built by a tool, or a file emitted by a schema compiler, should sit under ignores, as the config above does for src/generated/**.
Also, the async rules have exceptions. The no-await-in-loop page lists code that "should run serially", such as a countdown, where each await depends on the one before. There, disable the rule for that line with a comment that says why.
// Correct as written: each step must wait for the one before
async function printCountdown() {
  for (let i = 0; i < 10; i++) {
    // eslint-disable-next-line no-await-in-loop -- a countdown is serial by design
    await new Promise((resolve) => setTimeout(resolve, 1000)); // sleep 1 second
    console.log(i);
  }
}
That example comes from the rule's own page, as a case where awaiting in the loop is correct. Similarly, require-atomic-updates has an allowProperties option for teams that find its reports on object properties too noisy.
When to turn a rule off#
Finally, the complexity rule's own page has the last word: "If you can't determine an appropriate complexity limit for your code, then it's best to disable this rule". In short, JavaScript clean code practices are defaults, not laws. A rule that fires on code everyone agrees is fine teaches a team to ignore the linter, and that costs more than the rule saves.
Where should a team go after the config is in place?#
Once the config runs, the next steps are the language features behind these rules, the same ideas at class level, and modernising older code. The ECMAScript 2026 guide covers the newer syntax that keeps functions short.
For the single-job idea applied to classes, SOLID principles in Laravel walks through it in another stack. If the code is old enough that a linter is not the first problem, modernising legacy code covers where to start.
Some teams want a hand putting this in place. They can hire JavaScript developers, or look at maintenance and support for steady cleanup of an existing codebase. Even so, every one of these JavaScript clean code practices can be put in place with the eight documentation pages and a few afternoons. The pages are enough on their own.